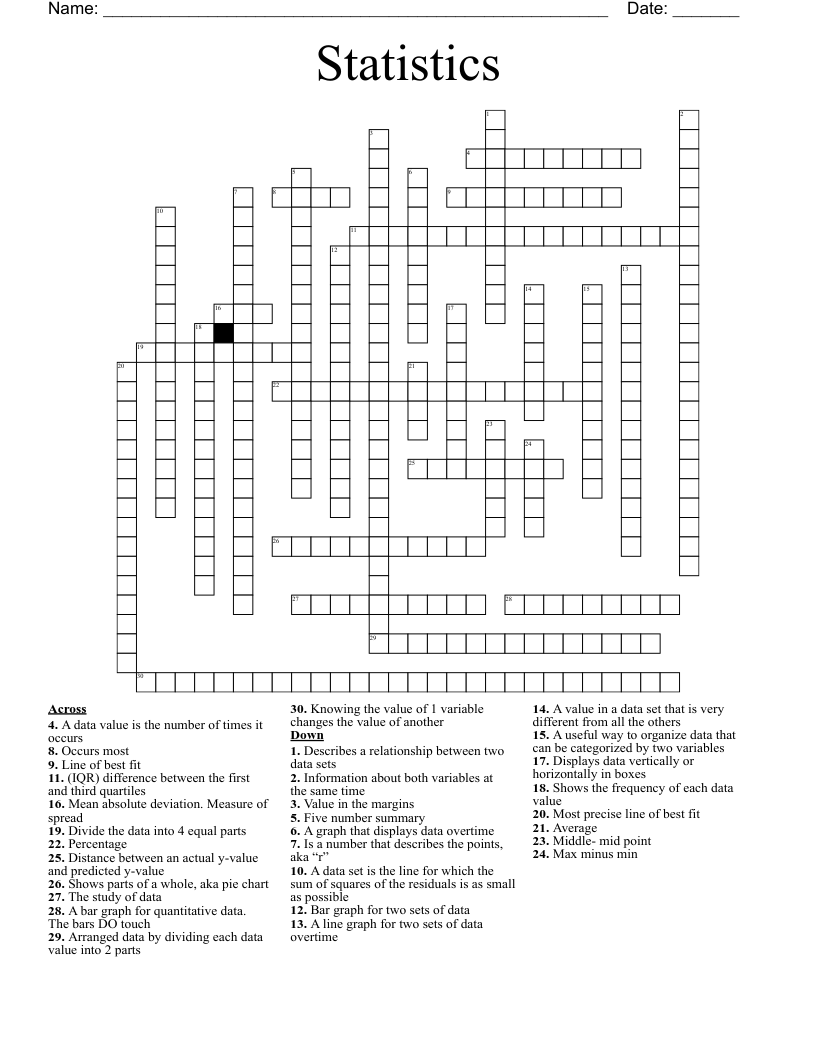
Statistics Crossword
This printable crossword puzzle has 30 clues. Answers range from 3 to 28 letters long. This crossword is also available to download as a Microsoft Word document or a PDF.
Description
Most precise line of best fit
A data set is the line for which the sum of squares of the residuals is as small as possible
Distance between an actual y-value and predicted y-value
Describes a relationship between two data sets
Line of best fit
Is a number that describes the points, aka “r”
A useful way to organize data that can be categorized by two variables
Percentage
Information about both variables at the same time
Value in the margins
Knowing the value of 1 variable changes the value of another
The study of data
Displays data vertically or horizontally in boxes
Bar graph for two sets of data
A graph that displays data overtime
A line graph for two sets of data overtime
Shows parts of a whole, aka pie chart
Arranged data by dividing each data value into 2 parts
A data value is the number of times it occurs
Shows the frequency of each data value
A bar graph for quantitative data. The bars DO touch
Mean absolute deviation. Measure of spread
Average
Middle- mid point
Occurs most
Max minus min
Divide the data into 4 equal parts
(IQR) difference between the first and third quartiles
A value in a data set that is very different from all the others
Five number summary