Statistics & Probability Crossword
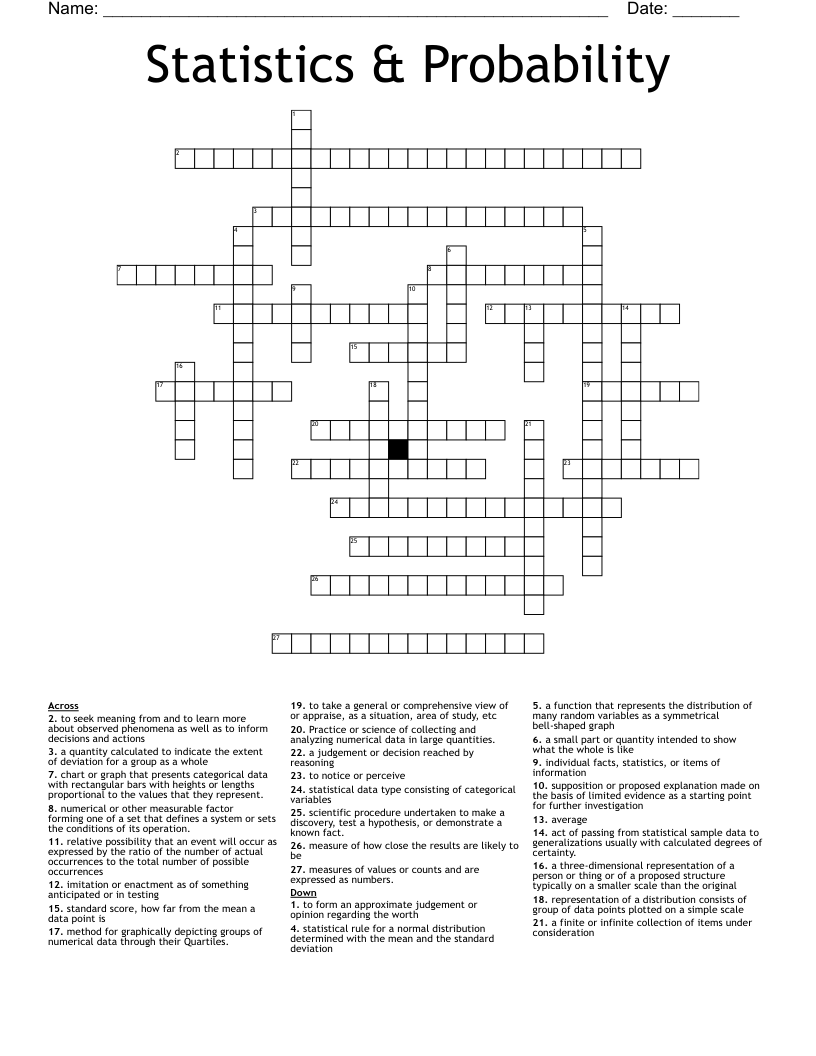
This printable crossword puzzle on the topic of Statistics & Probability has 27 clues. Answers range from 4 to 24 letters long. This crossword is also available to download as a Microsoft Word document or a PDF.
Description
act of passing from statistical sample data to generalizations usually with calculated degrees of certainty.
a judgement or decision reached by reasoning
scientific procedure undertaken to make a discovery, test a hypothesis, or demonstrate a known fact.
Practice or science of collecting and analyzing numerical data in large quantities.
a finite or infinite collection of items under consideration
numerical or other measurable factor forming one of a set that defines a system or sets the conditions of its operation.
a small part or quantity intended to show what the whole is like
a three-dimensional representation of a person or thing or of a proposed structure typically on a smaller scale than the original
individual facts, statistics, or items of information
imitation or enactment as of something anticipated or in testing
relative possibility that an event will occur as expressed by the ratio of the number of actual occurrences to the total number of possible occurrences
to take a general or comprehensive view of or appraise, as a situation, area of study, etc
average
to form an approximate judgement or opinion regarding the worth
measure of how close the results are likely to be
to seek meaning from and to learn more about observed phenomena as well as to inform decisions and actions
standard score, how far from the mean a data point is
a function that represents the distribution of many random variables as a symmetrical bell-shaped graph
statistical rule for a normal distribution determined with the mean and the standard deviation
a quantity calculated to indicate the extent of deviation for a group as a whole
statistical data type consisting of categorical variables
measures of values or counts and are expressed as numbers.
method for graphically depicting groups of numerical data through their Quartiles.
chart or graph that presents categorical data with rectangular bars with heights or lengths proportional to the values that they represent.
representation of a distribution consists of group of data points plotted on a simple scale
supposition or proposed explanation made on the basis of limited evidence as a starting point for further investigation
to notice or perceive