Statistics and Probability Crossword
This printable crossword puzzle on the topic of Statistics & Probability has 27 clues. Answers range from 4 to 24 letters long. This crossword is also available to download as a Microsoft Word document or a PDF.
Description
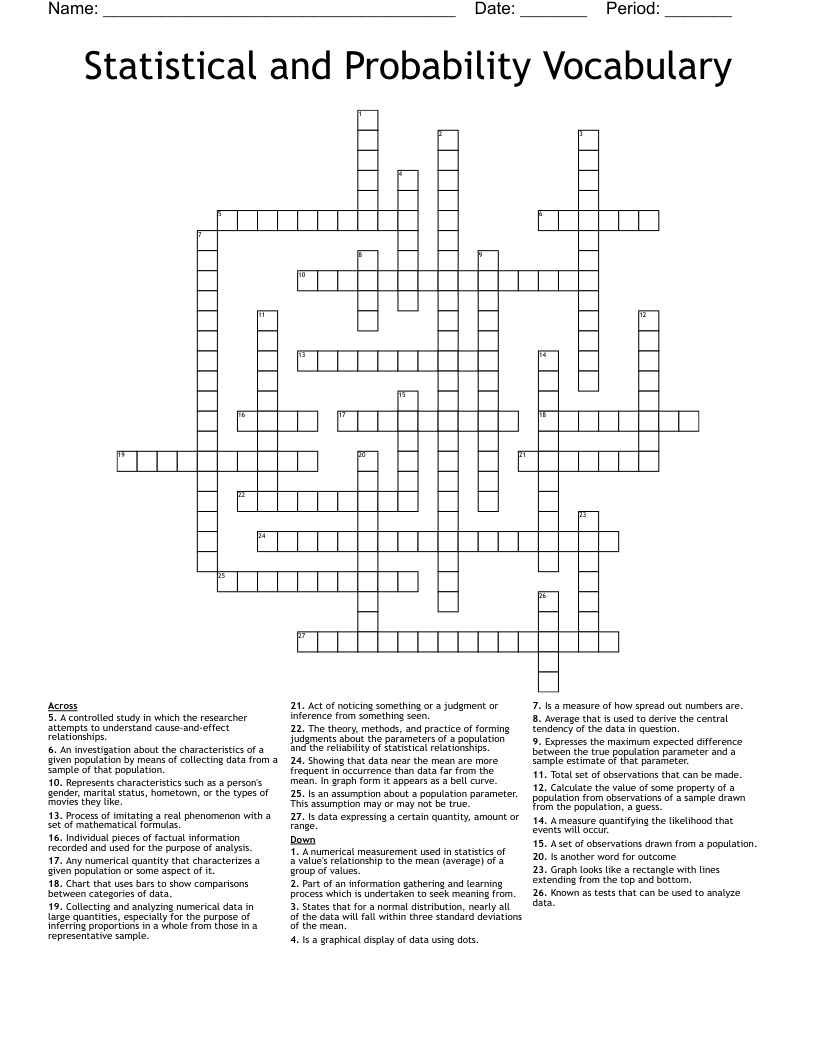
Process of drawing conclusions about a population on the basis of measurements or observations made on a sample of units from the population.
Involves ensuring the use of adequate sampling procedure, appropriate statistical tests, and reliable measurement procedures.
Investigate the cause and effect of a relationship between two variables.
Form of math analysis that uses quantified models, representations and synapses for a given set of experimental data or real life studies.
term for any collection of "units." Parameter, Any numerical quantity that characterizes a given population or tells something about the whole population.
Set of data collected and the world selected from a statistical population by a defined procedure.
Embodies a set of statistical assumptions concerning the generation of sample data
Individual pieces of factual information recorded and used for the purpose of analysis. Simulation, using artificially generated data in order to test out a hypothesis or statistical method.
Measure of the likelihood that an event will occur in a random experiment. Survey, Investigation about the characteristics of a given population.
"average;" Add up all numbers and divide by the amount of numbers used.
Data analysis framework, uses combination of effect sizes, confidence intervals, precision planning and meta-analysis to plan experiments, analyze data and interpret results.
A statistic expressing the amount of random sampling error in a survey's result
Part of an info gathering and learning process undertaken to seek meaning from and to learn more about observed phenomena as well as to inform decisions and actions.
Numerical measurement used in statistics of a value's relationship to the mean of a group of values.
Probability function that describes how the value of a variable are distributed.
three-sigma rule or 68-95-99.7; states that for a normal distribution, almost all data falls within three standard deviations.
collected data that can't be written as numbers
collected data that consists of numerical numbers that can be put in order
method for graphically depicting groups of numerical data through their quartiles.
a chart or graph that presents categorical data with rectangular bars with heights or lengths proportional to the values that they represent.
statistical chart consisting of data points plotted on a fairly simple scale, typically using filled in circles.
assumption about a population parameter.
value of something of interest you're measuring or counting during a study or experiment.
quantity entering into the probability distribution of a statistic or a random variable.
way to model random events
investigation about the characteristics of a given population by means of collecting data from a sample of that population and estimating their characteristics through the systematic use of statistical methodology.
measure of the amount of variation or dispersion of a set of values