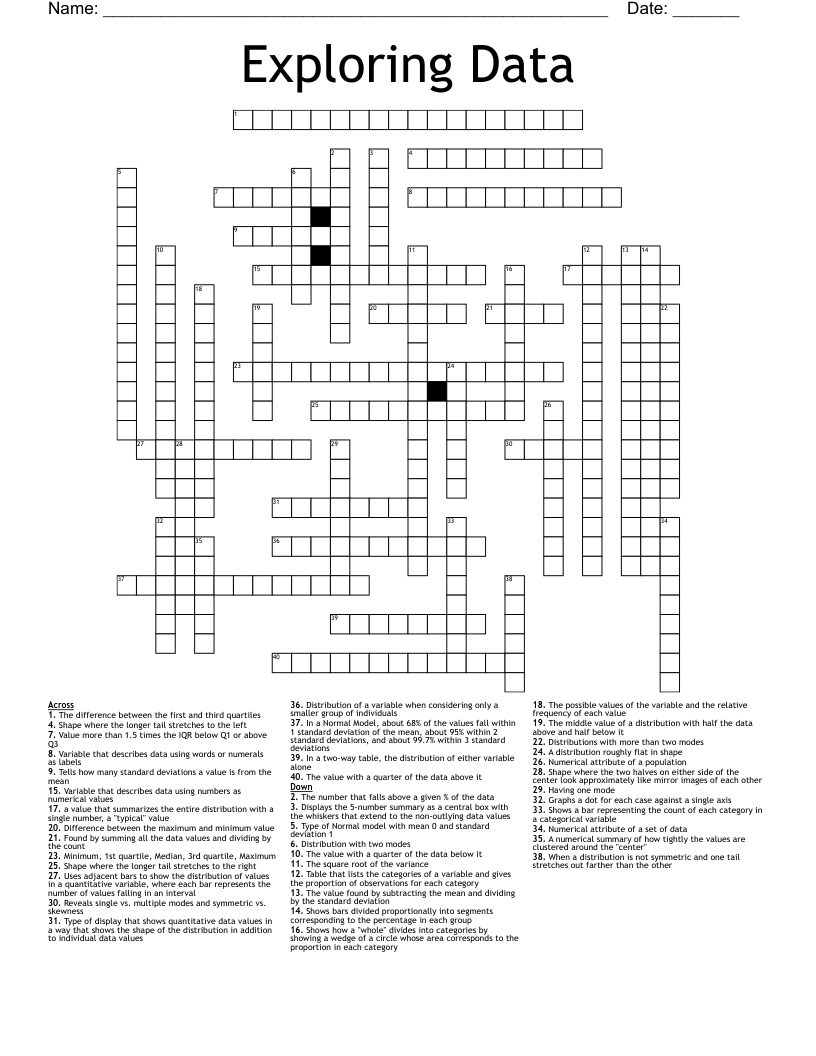
Exploring Data Crossword
This printable crossword puzzle on the topic of Statistics & Probability has 40 clues. Answers range from 4 to 18 letters long. This crossword is also available to download as a Microsoft Word document or a PDF.
Description
Variable that describes data using words or numerals as labels
Variable that describes data using numbers as numerical values
The possible values of the variable and the relative frequency of each value
In a two-way table, the distribution of either variable alone
Distribution of a variable when considering only a smaller group of individuals
Table that lists the categories of a variable and gives the proportion of observations for each category
Shows a bar representing the count of each category in a categorical variable
Shows how a "whole" divides into categories by showing a wedge of a circle whose area corresponds to the proportion in each category
Shows bars divided proportionally into segments corresponding to the percentage in each group
When a distribution is not symmetric and one tail stretches out farther than the other
Distribution with two modes
Uses adjacent bars to show the distribution of values in a quantitative variable, where each bar represents the number of values falling in an interval
A numerical summary of how tightly the values are clustered around the "center"
A distribution roughly flat in shape
Distributions with more than two modes
Shape where the two halves on either side of the center look approximately like mirror images of each other
Shape where the longer tail stretches to the right
Type of display that shows quantitative data values in a way that shows the shape of the distribution in addition to individual data values
Shape where the longer tail stretches to the left
Having one mode
Graphs a dot for each case against a single axis
Reveals single vs. multiple modes and symmetric vs. skewness
a value that summarizes the entire distribution with a single number, a "typical" value
Tells how many standard deviations a value is from the mean
Numerical attribute of a population
In a Normal Model, about 68% of the values fall within 1 standard deviation of the mean, about 95% within 2 standard deviations, and about 99.7% within 3 standard deviations
The value found by subtracting the mean and dividing by the standard deviation
Type of Normal model with mean 0 and standard deviation 1
Numerical attribute of a set of data
The number that falls above a given % of the data
Displays the 5-number summary as a central box with the whiskers that extend to the non-outlying data values
Minimum, 1st quartile, Median, 3rd quartile, Maximum
Found by summing all the data values and dividing by the count
The difference between the first and third quartiles
The square root of the variance
The value with a quarter of the data below it
Value more than 1.5 times the IQR below Q1 or above Q3
Difference between the maximum and minimum value
The value with a quarter of the data above it
The middle value of a distribution with half the data above and half below it