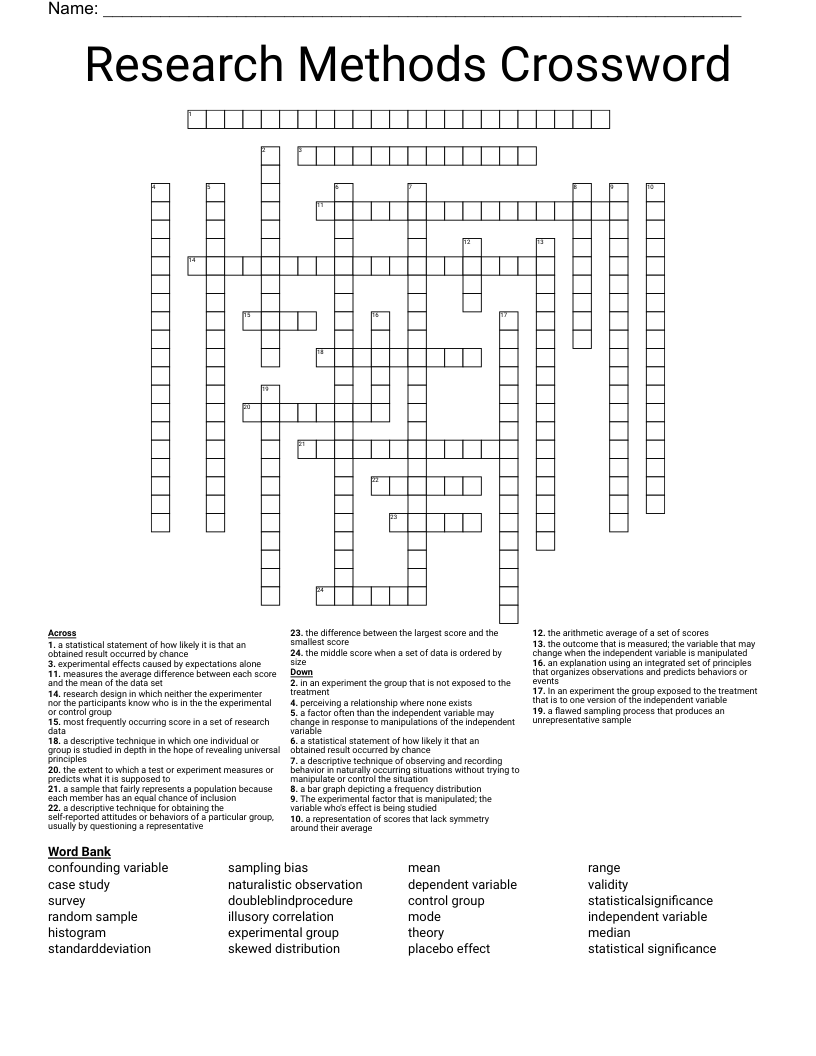
Research Methods Crossword
This printable crossword puzzle on the topic of Psychology & Sociology has 24 clues. Answers range from 4 to 23 letters long. This crossword is also available to download as a Microsoft Word document or a PDF.
Description
research design in which neither the experimenter nor the participants know who is in the the experimental or control group
measures the average difference between each score and the mean of the data set
a statistical statement of how likely it is that an obtained result occurred by chance
a descriptive technique for obtaining the self-reported attitudes or behaviors of a particular group, usually by questioning a representative
the difference between the largest score and the smallest score
most frequently occurring score in a set of research data
the arithmetic average of a set of scores
the middle score when a set of data is ordered by size
a descriptive technique in which one individual or group is studied in depth in the hope of revealing universal principles
a flawed sampling process that produces an unrepresentative sample
an explanation using an integrated set of principles that organizes observations and predicts behaviors or events
the extent to which a test or experiment measures or predicts what it is supposed to
a sample that fairly represents a population because each member has an equal chance of inclusion
a descriptive technique of observing and recording behavior in naturally occurring situations without trying to manipulate or control the situation
experimental effects caused by expectations alone
In an experiment the group exposed to the treatment that is to one version of the independent variable
in an experiment the group that is not exposed to the treatment
perceiving a relationship where none exists
a factor often than the independent variable may change in response to manipulations of the independent variable
a representation of scores that lack symmetry around their average
The experimental factor that is manipulated; the variable who's effect is being studied
a statistical statement of how likely it that an obtained result occurred by chance
a bar graph depicting a frequency distribution
the outcome that is measured; the variable that may change when the independent variable is manipulated