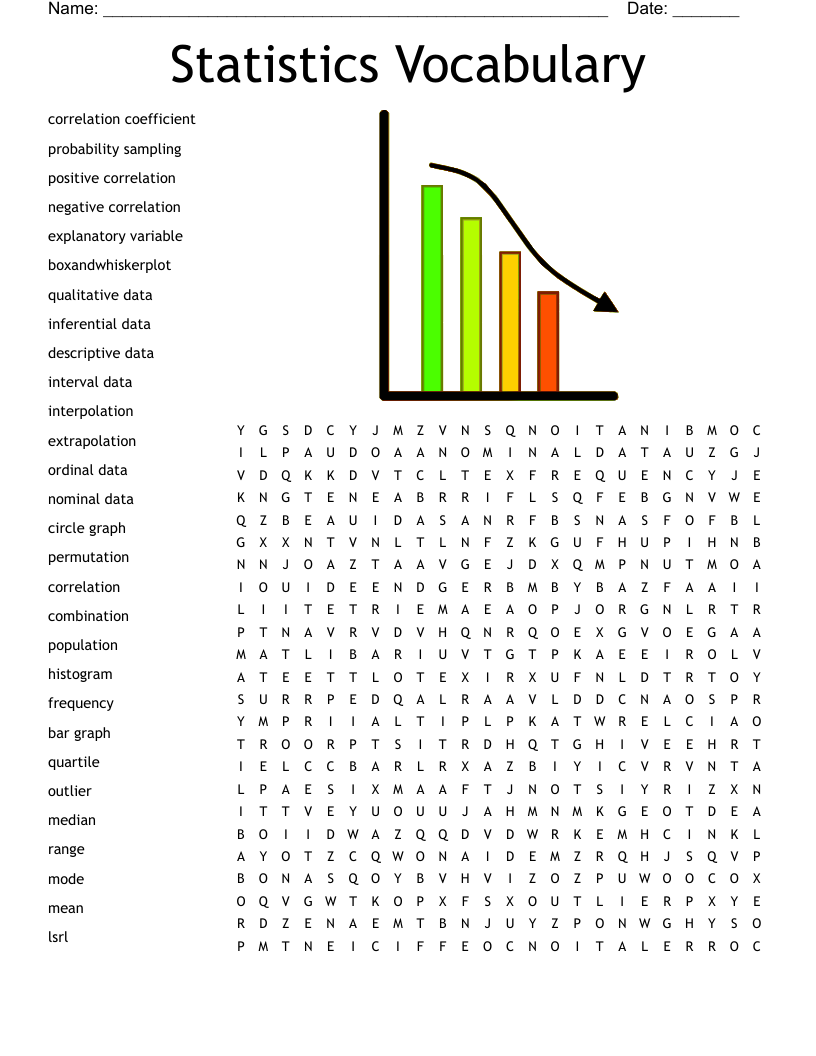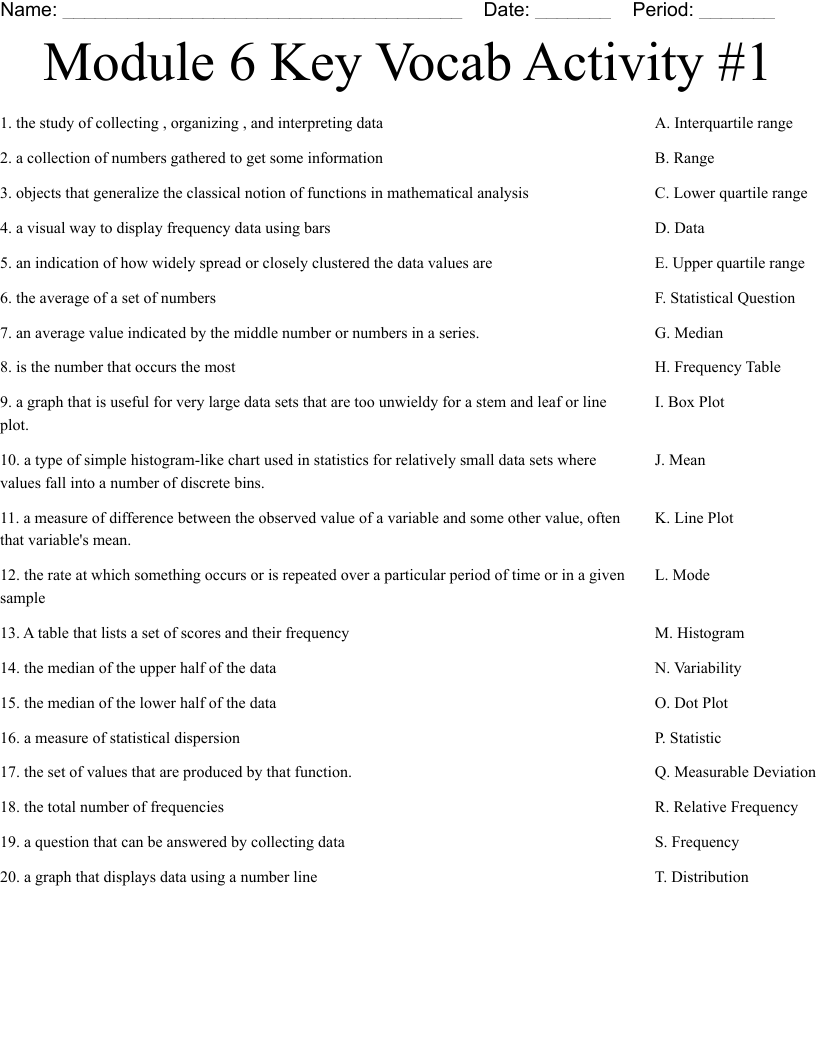
Module 6 Key Vocab Activity #1 Worksheet
This printable matching worksheet on the topic of Statistics & Probability has 20 questions and answers to match. This matching worksheet is also available to download as a Microsoft Word document or a PDF.
Description
the study of collecting , organizing , and interpreting data
a collection of numbers gathered to get some information
objects that generalize the classical notion of functions in mathematical analysis
a visual way to display frequency data using bars
an indication of how widely spread or closely clustered the data values are
the average of a set of numbers
an average value indicated by the middle number or numbers in a series.
is the number that occurs the most
a graph that is useful for very large data sets that are too unwieldy for a stem and leaf or line plot.
a type of simple histogram-like chart used in statistics for relatively small data sets where values fall into a number of discrete bins.
a measure of difference between the observed value of a variable and some other value, often that variable's mean.
the rate at which something occurs or is repeated over a particular period of time or in a given sample
A table that lists a set of scores and their frequency
the median of the upper half of the data
the median of the lower half of the data
a measure of statistical dispersion
the set of values that are produced by that function.
the total number of frequencies
a question that can be answered by collecting data
a graph that displays data using a number line