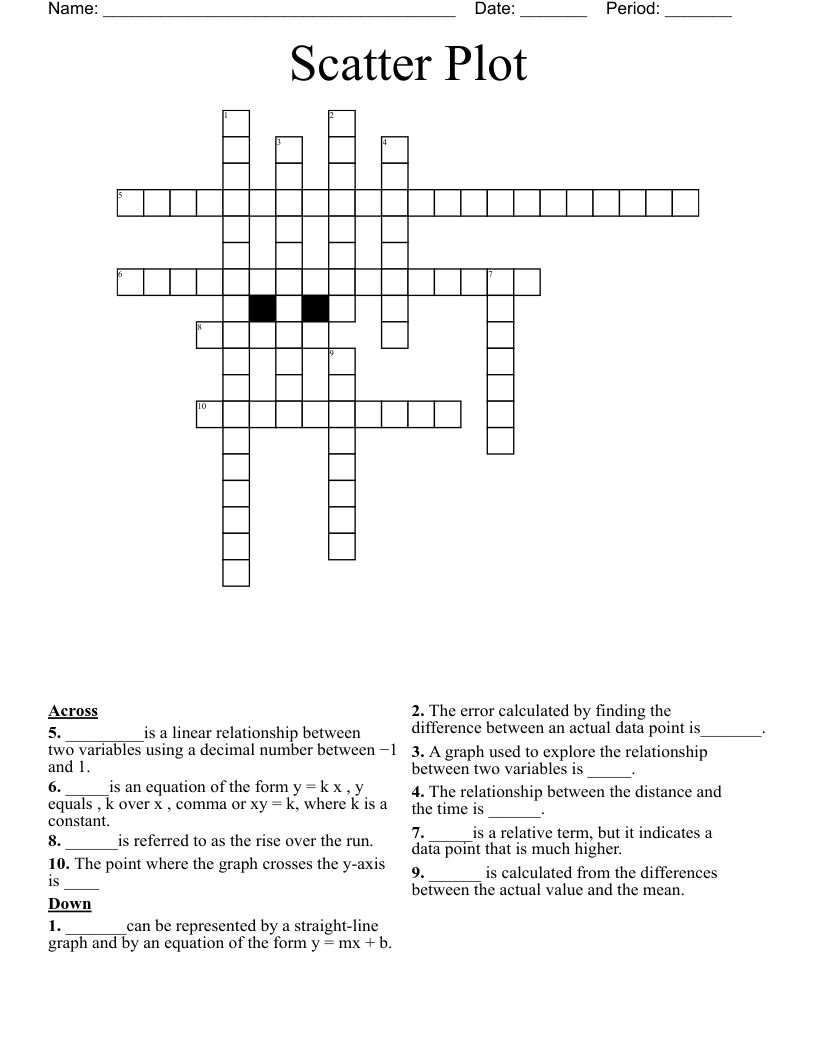
Scatter Plot Crossword
This printable crossword puzzle on the topic of Statistics & Probability has 10 clues. Answers range from 5 to 22 letters long. This crossword is also available to download as a Microsoft Word document or a PDF.
Description
_________is a linear relationship between two variables using a decimal number between −1 and 1.
_____is an equation of the form y = k x , y equals , k over x , comma or xy = k, where k is a constant.
_______can be represented by a straight-line graph and by an equation of the form y = mx + b.
A graph used to explore the relationship between two variables is _____.
The point where the graph crosses the y-axis is ____
______is referred to as the rise over the run.
______ is calculated from the differences between the actual value and the mean.
The relationship between the distance and the time is ______.
_____is a relative term, but it indicates a data point that is much higher.
The error calculated by finding the difference between an actual data point is_______.