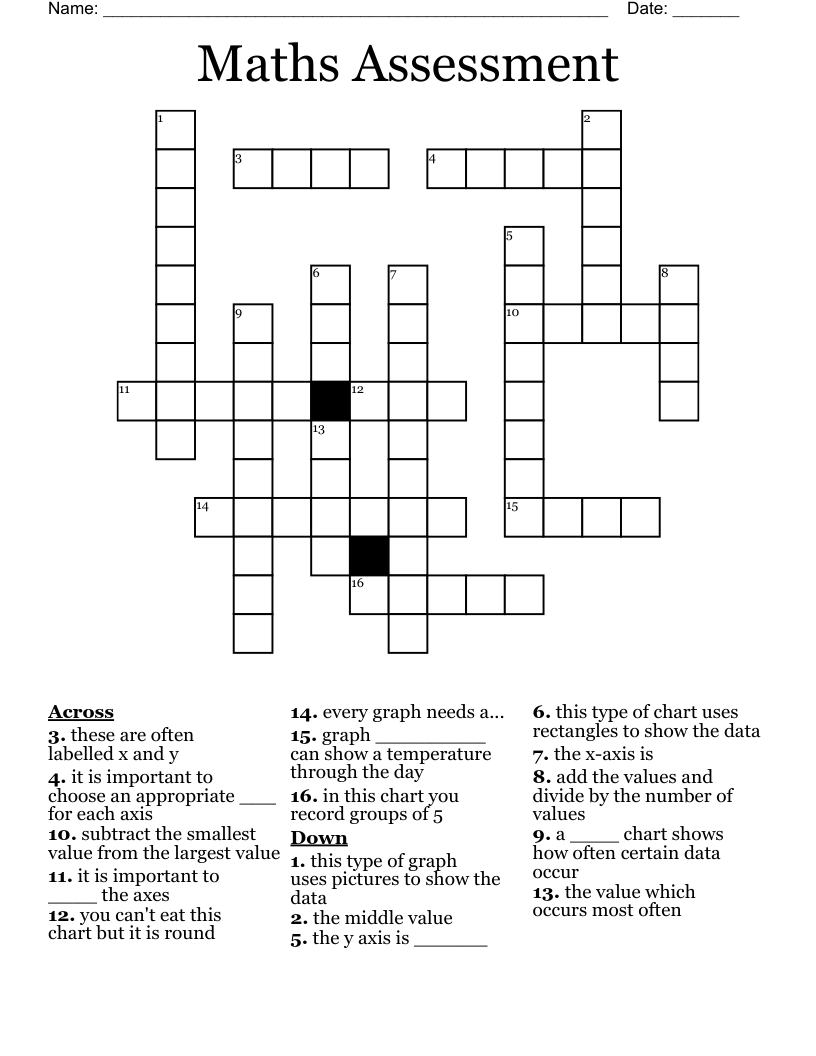
Maths Assessment Crossword
This printable crossword puzzle on the topic of Statistics & Probability has 16 clues. Answers range from 3 to 10 letters long. This crossword is also available to download as a Microsoft Word document or a PDF.
Description
every graph needs a...
the value which occurs most often
the x-axis is
this type of chart uses rectangles to show the data
these are often labelled x and y
the middle value
you can't eat this chart but it is round
a ____ chart shows how often certain data occur
this type of graph uses pictures to show the data
it is important to choose an appropriate ___ for each axis
add the values and divide by the number of values
subtract the smallest value from the largest value
it is important to ____ the axes
the y axis is ______
graph _________ can show a temperature through the day
in this chart you record groups of 5