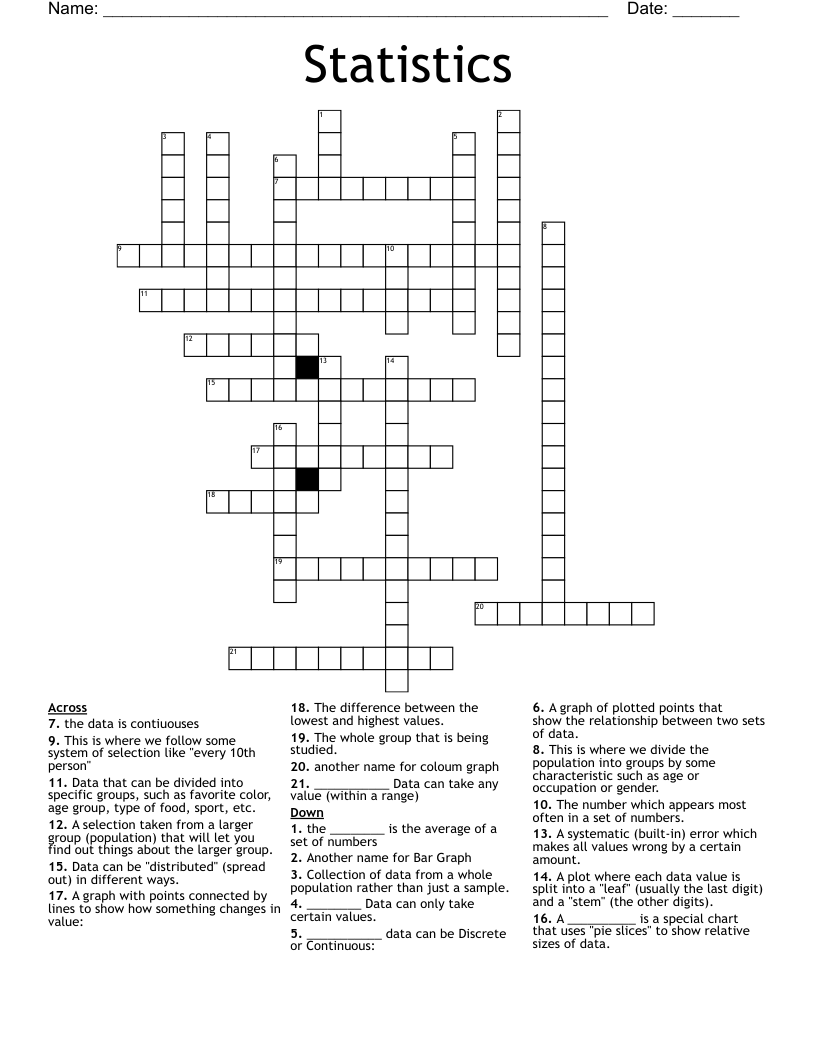
Statistics Crossword
This printable crossword puzzle has 21 clues. Answers range from 4 to 18 letters long. This crossword is also available to download as a Microsoft Word document or a PDF.
Description
the ________ is the average of a set of numbers
A selection taken from a larger group (population) that will let you find out things about the larger group.
Collection of data from a whole population rather than just a sample.
A plot where each data value is split into a "leaf" (usually the last digit) and a "stem" (the other digits).
The number which appears most often in a set of numbers.
the data is contiuouses
The difference between the lowest and highest values.
___________ data can be Discrete or Continuous:
Data that can be divided into specific groups, such as favorite color, age group, type of food, sport, etc.
________ Data can only take certain values.
___________ Data can take any value (within a range)
This is where we divide the population into groups by some characteristic such as age or occupation or gender.
Data can be "distributed" (spread out) in different ways.
This is where we follow some system of selection like "every 10th person"
The whole group that is being studied.
A systematic (built-in) error which makes all values wrong by a certain amount.
A __________ is a special chart that uses "pie slices" to show relative sizes of data.
A graph of plotted points that show the relationship between two sets of data.
A graph with points connected by lines to show how something changes in value:
Another name for Bar Graph
another name for coloum graph