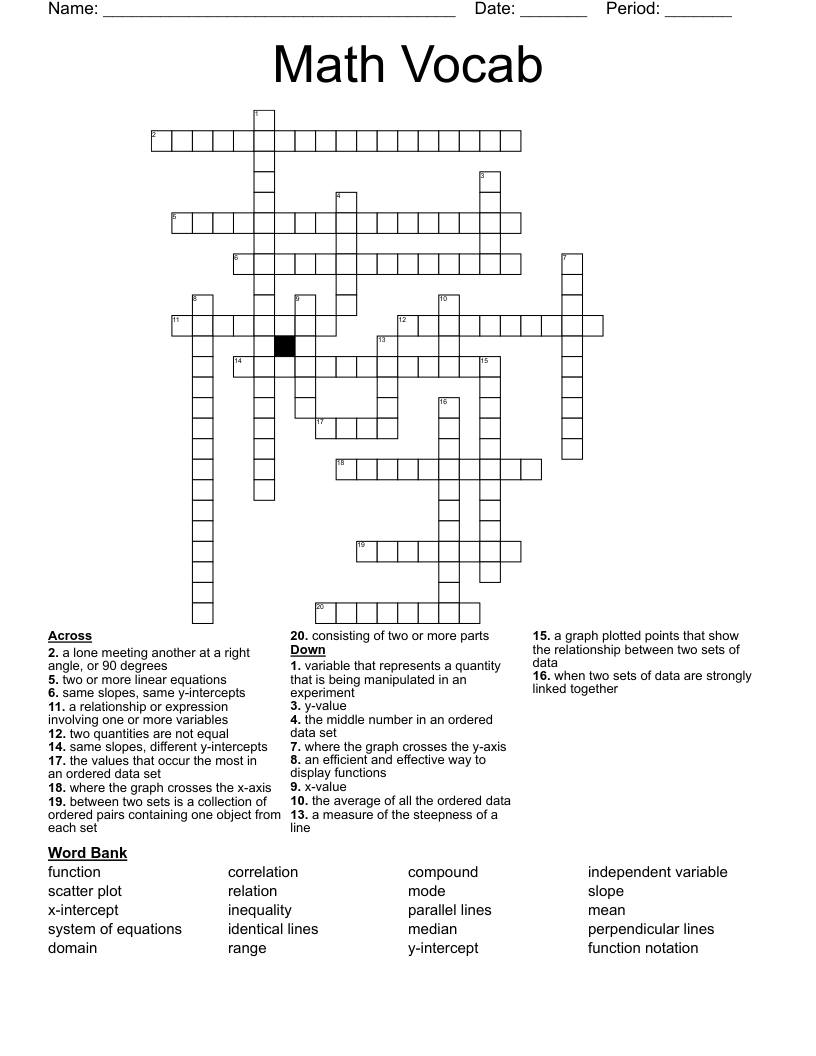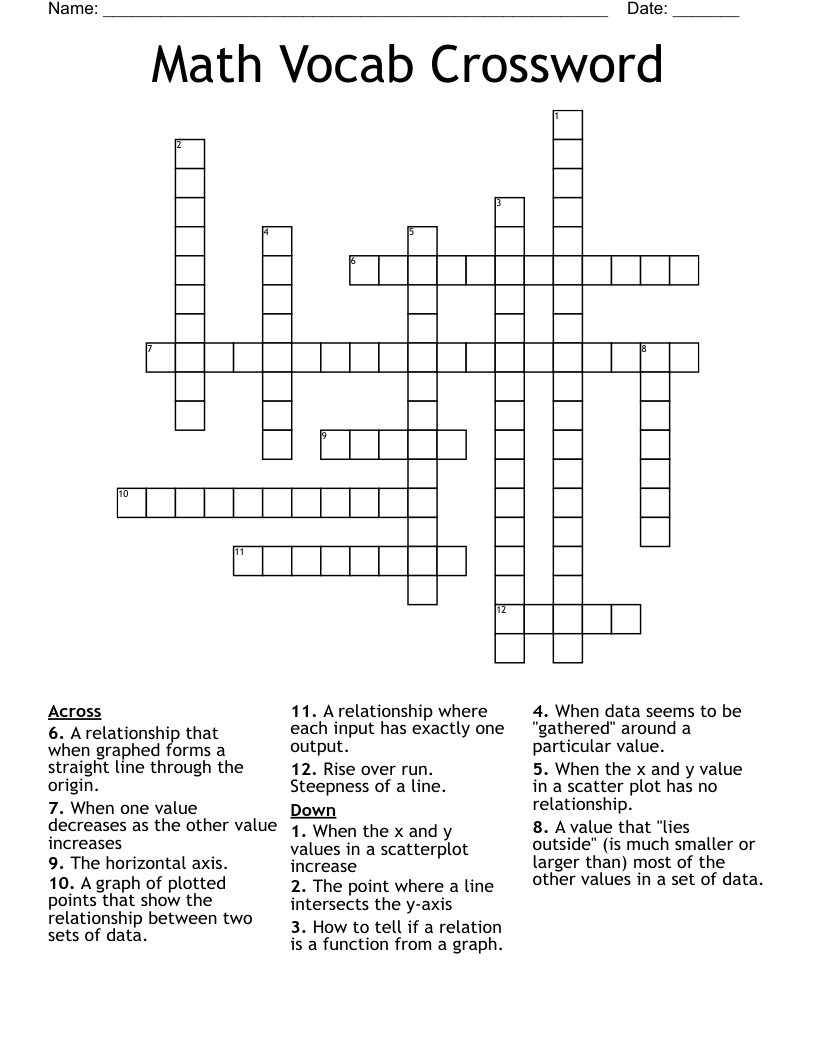
Math Vocab Crossword
This printable crossword puzzle on the topic of Statistics & Probability has 12 clues. Answers range from 5 to 19 letters long. This crossword is also available to download as a Microsoft Word document or a PDF.
Description
A graph of plotted points that show the relationship between two sets of data.
A value that "lies outside" (is much smaller or larger than) most of the other values in a set of data.
When one value decreases as the other value increases
When data seems to be "gathered" around a particular value.
When the x and y value in a scatter plot has no relationship.
When the x and y values in a scatterplot increase
A relationship that when graphed forms a straight line through the origin.
Rise over run. Steepness of a line.
The point where a line intersects the y-axis
A relationship where each input has exactly one output.
How to tell if a relation is a function from a graph.
The horizontal axis.