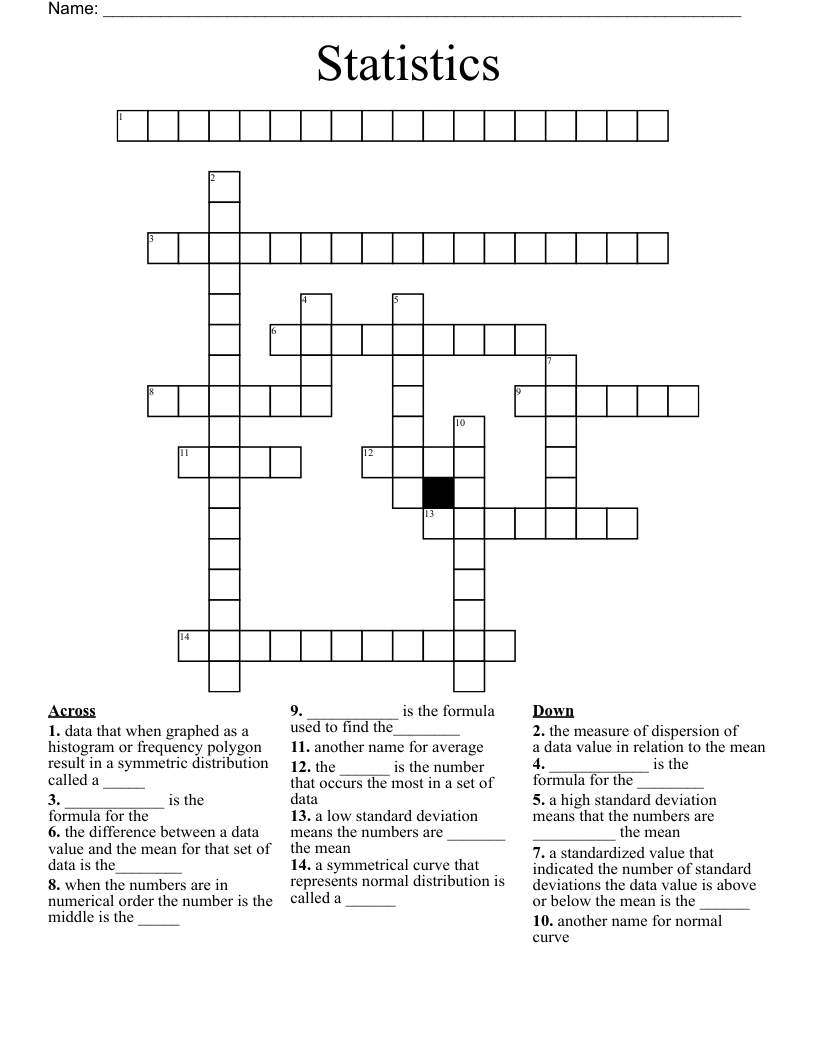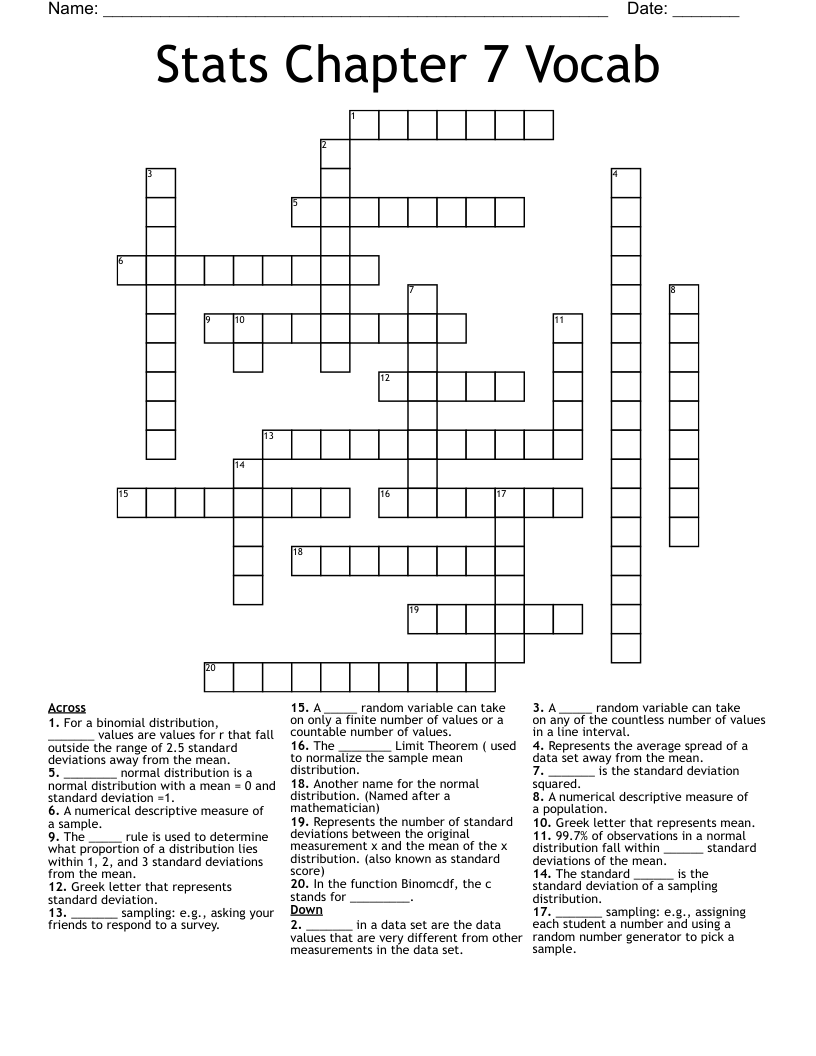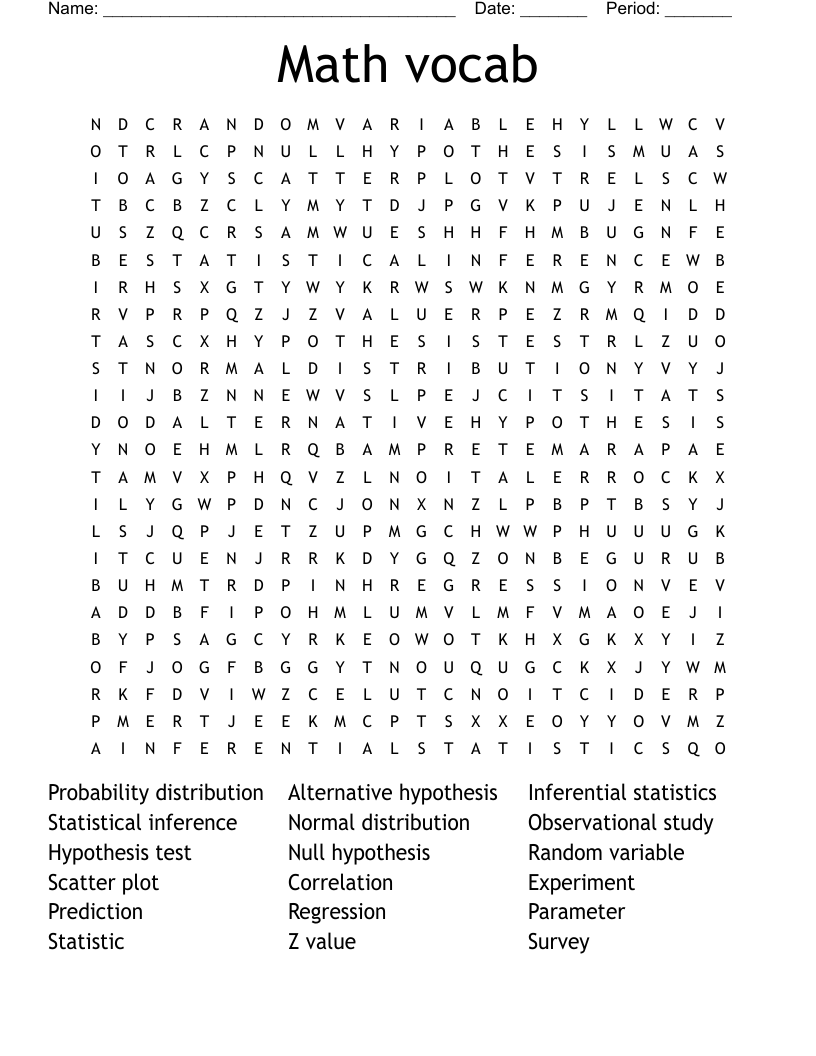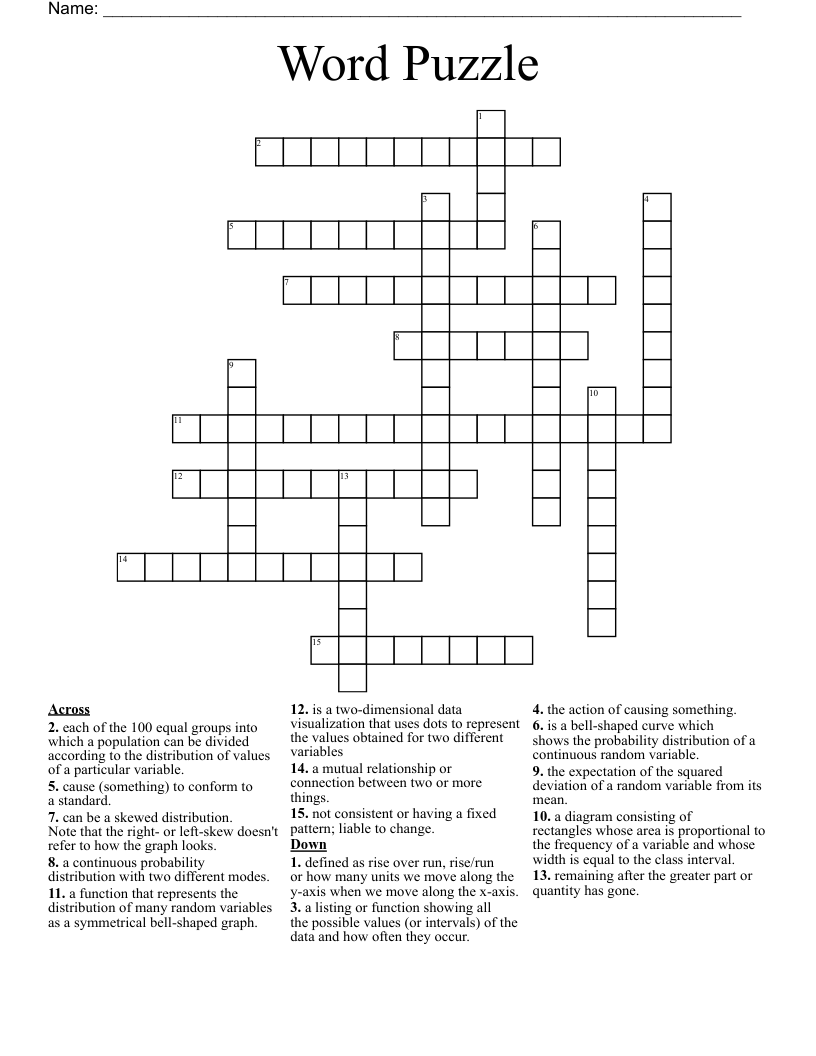
stats Crossword
This printable crossword puzzle on the topic of Statistics & Probability has 14 clues. Answers range from 8 to 26 letters long. This crossword is also available to download as a Microsoft Word document or a PDF.
Description
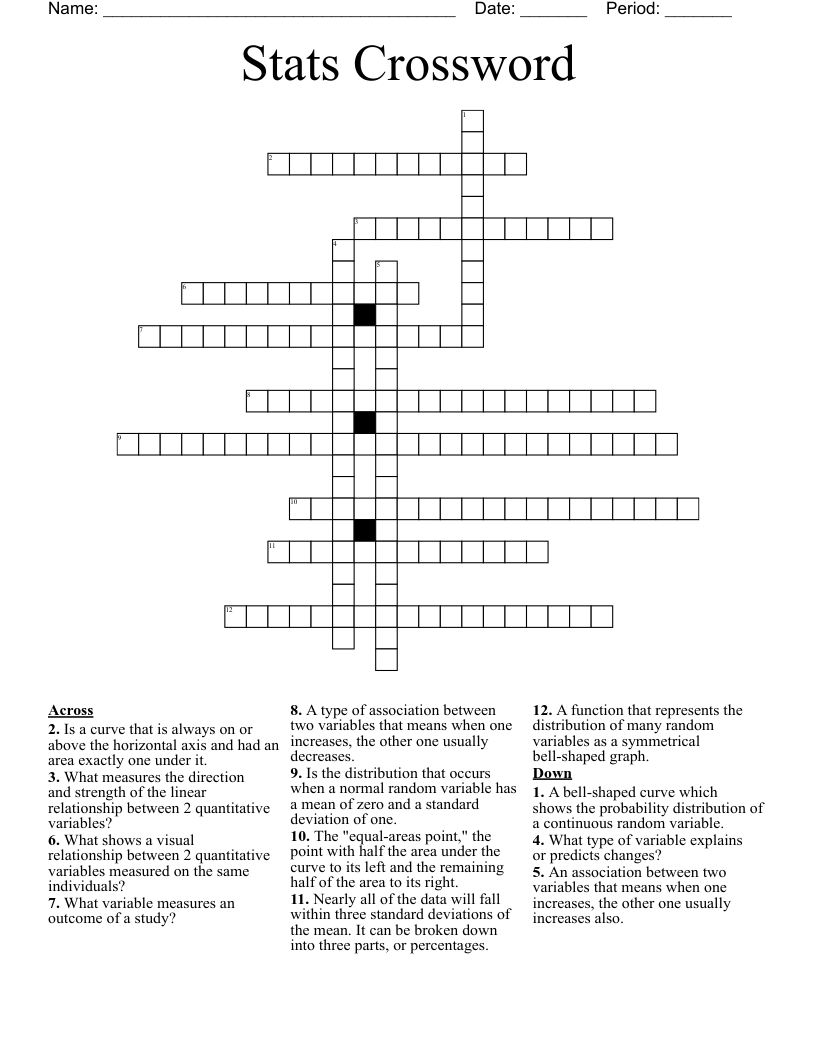
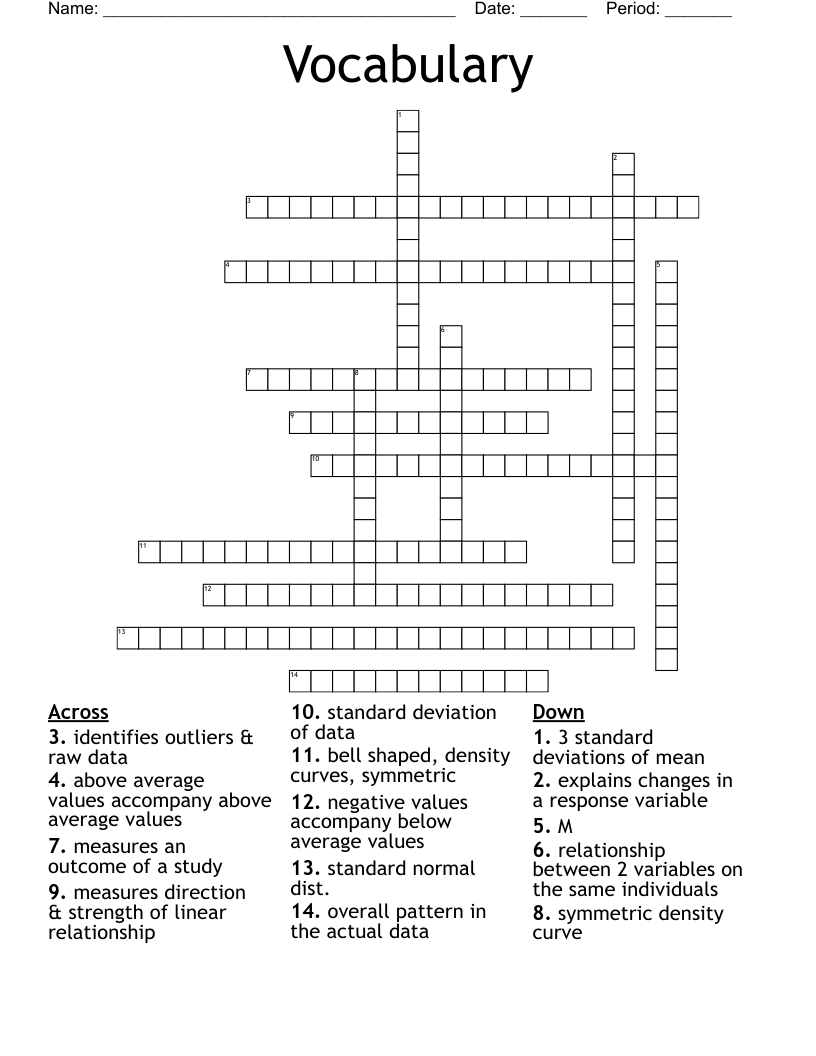
the strength of a relationship is determined by how close the points in the scatter plot lie to simple form such a line
displays relationship between two quantitative variables measured on the same individuals.
what is variable x
whats is variable y
looking for an overall pattern
departure of the patterns
measures the strength and direction of the linear association
being able to describe the overall pattern of a distribution
a quantity calculated to indicate the extent of deviation for a group as a whole.
a function that represents the distribution of many random variables as a symmetrical bell-shaped graph.
A normal curve is a bell-shaped curve which shows the probability distribution of a continuous random variable
The normal random variable of a standard normal distribution is called a standard score or a z score.
The normal probability plot is a graphical technique to identify substantive departures from normality.
empirical rule