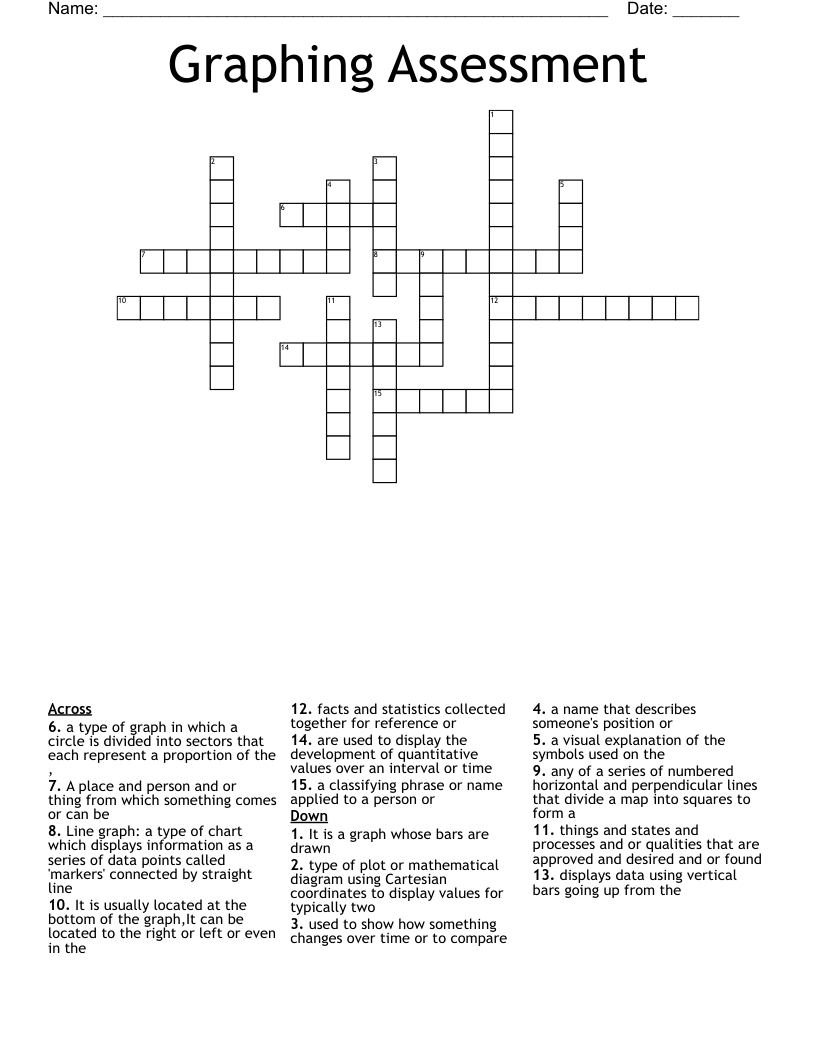
Graphing Assessment Crossword
This printable crossword puzzle on the topic of Statistics & Probability has 15 clues. Answers range from 4 to 13 letters long. This crossword is also available to download as a Microsoft Word document or a PDF.
Description
used to show how something changes over time or to compare
a type of graph in which a circle is divided into sectors that each represent a proportion of the ,
facts and statistics collected together for reference or
Line graph: a type of chart which displays information as a series of data points called 'markers' connected by straight line
type of plot or mathematical diagram using Cartesian coordinates to display values for typically two
a classifying phrase or name applied to a person or
It is a graph whose bars are drawn
displays data using vertical bars going up from the
a name that describes someone's position or
any of a series of numbered horizontal and perpendicular lines that divide a map into squares to form a
a visual explanation of the symbols used on the
things and states and processes and or qualities that are approved and desired and or found
A place and person and or thing from which something comes or can be
are used to display the development of quantitative values over an interval or time
It is usually located at the bottom of the graph,It can be located to the right or left or even in the