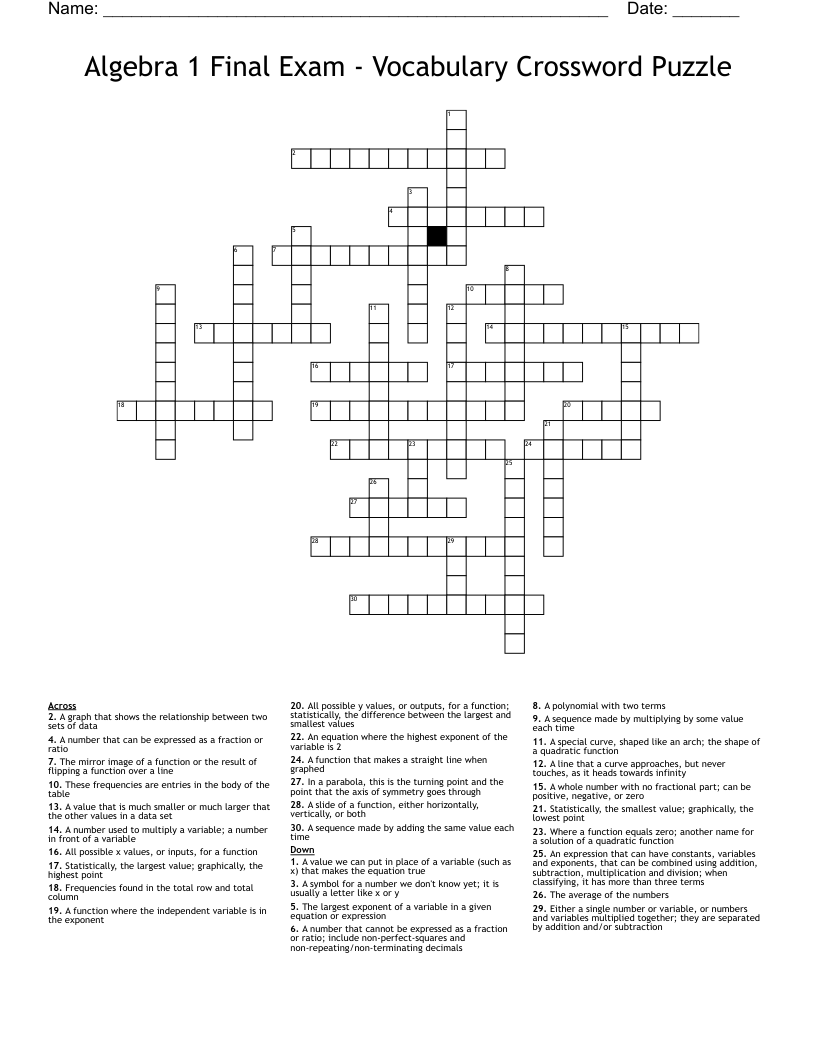
Algebra 1 Final Exam - Vocabulary Crossword Puzzle
This printable crossword puzzle on the topic of Algebra has 30 clues. Answers range from 4 to 11 letters long. This crossword is also available to download as a Microsoft Word document or a PDF.
Description
A sequence made by adding the same value each time
A line that a curve approaches, but never touches, as it heads towards infinity
A special curve, shaped like an arch; the shape of a quadratic function
The average of the numbers
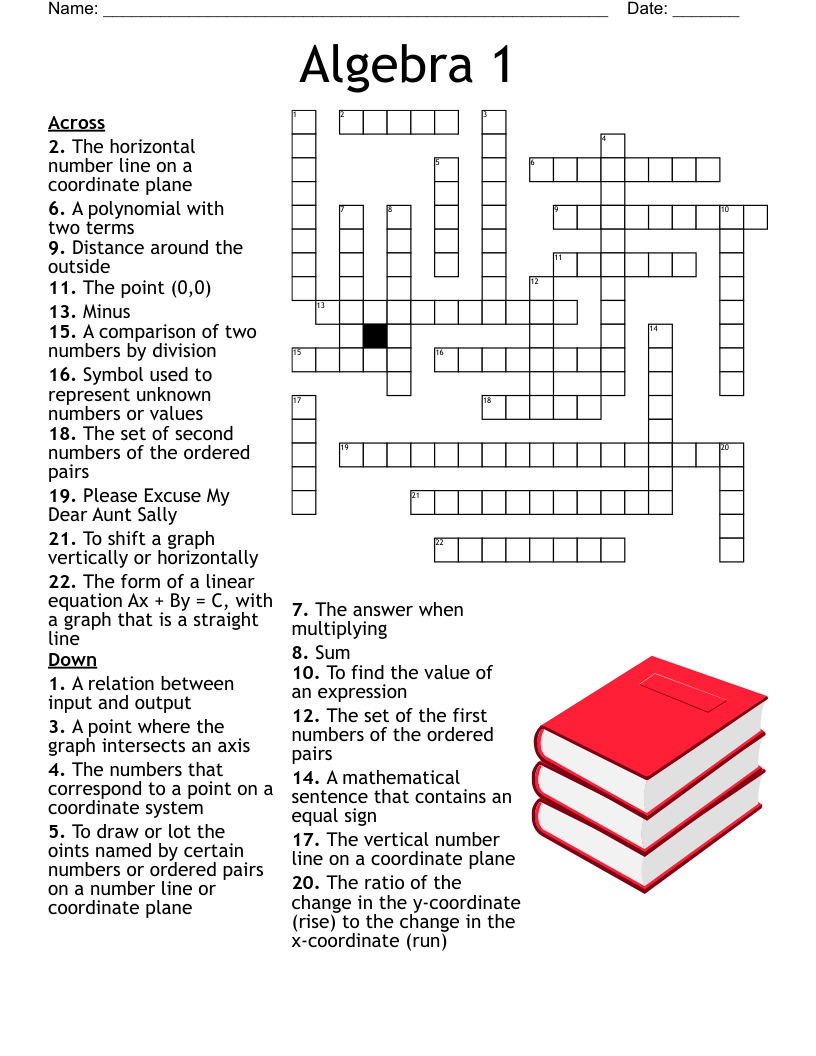
A polynomial with two terms
A symbol for a number we don't know yet; it is usually a letter like x or y
All possible y values, or outputs, for a function; statistically, the difference between the largest and smallest values
All possible x values, or inputs, for a function
A sequence made by multiplying by some value each time
A function where the independent variable is in the exponent
A function that makes a straight line when graphed
An equation where the highest exponent of the variable is 2
Where a function equals zero; another name for a solution of a quadratic function
A slide of a function, either horizontally, vertically, or both
A value we can put in place of a variable (such as x) that makes the equation true
The mirror image of a function or the result of flipping a function over a line
A number used to multiply a variable; a number in front of a variable
The largest exponent of a variable in a given equation or expression
Either a single number or variable, or numbers and variables multiplied together; they are separated by addition and/or subtraction
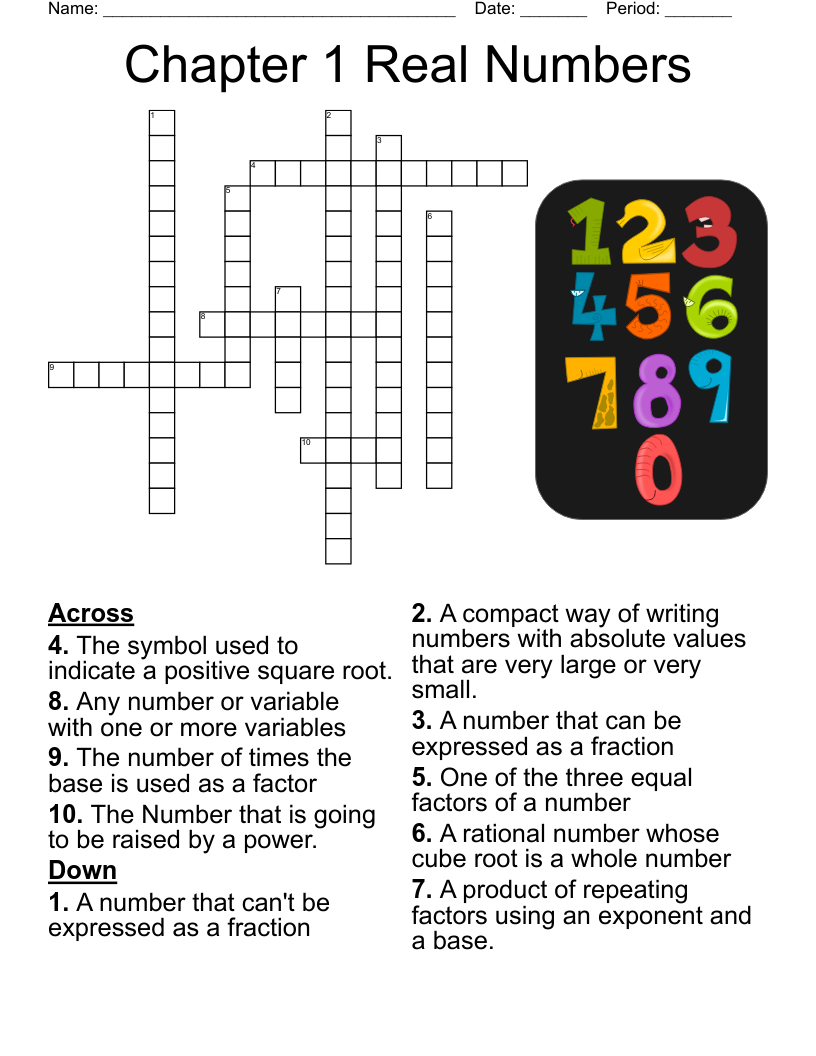
A number that can be expressed as a fraction or ratio
A number that cannot be expressed as a fraction or ratio; include non-perfect-squares and non-repeating/non-terminating decimals
A whole number with no fractional part; can be positive, negative, or zero
Statistically, the largest value; graphically, the highest point
Statistically, the smallest value; graphically, the lowest point
A value that is much smaller or much larger that the other values in a data set
An expression that can have constants, variables and exponents, that can be combined using addition, subtraction, multiplication and division; when classifying, it has more than three terms
In a parabola, this is the turning point and the point that the axis of symmetry goes through
A graph that shows the relationship between two sets of data
Frequencies found in the total row and total column
These frequencies are entries in the body of the table