math vocabulary Crossword
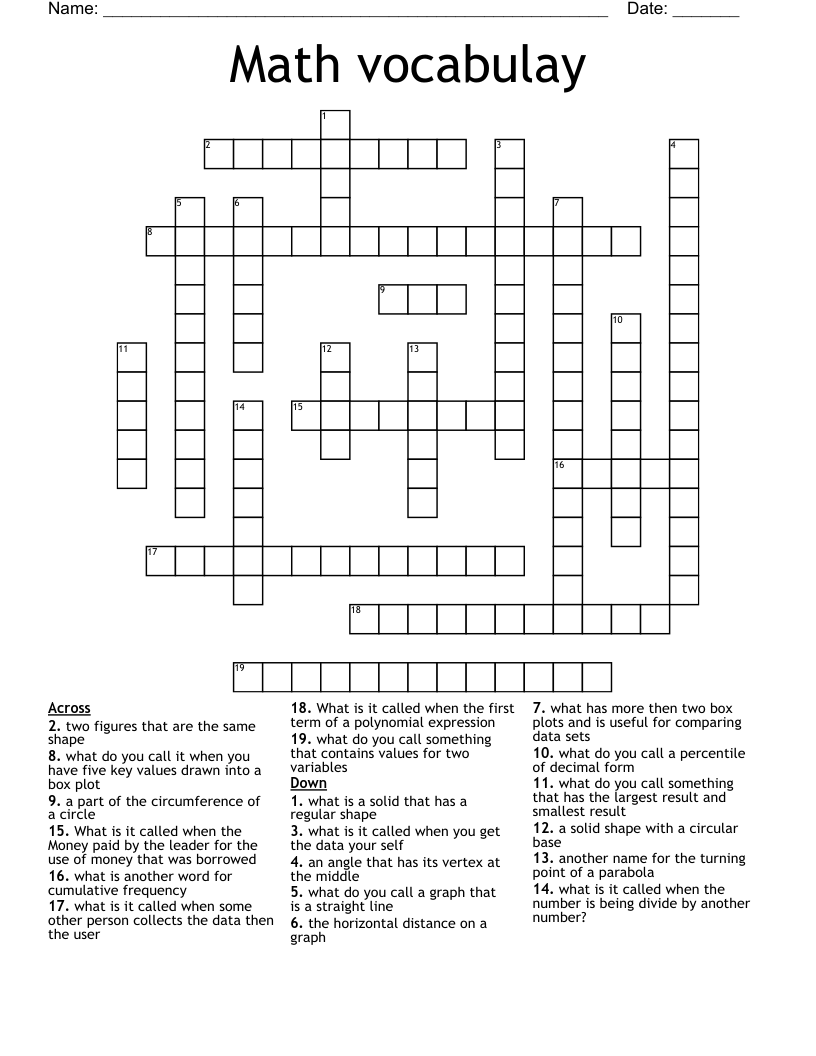
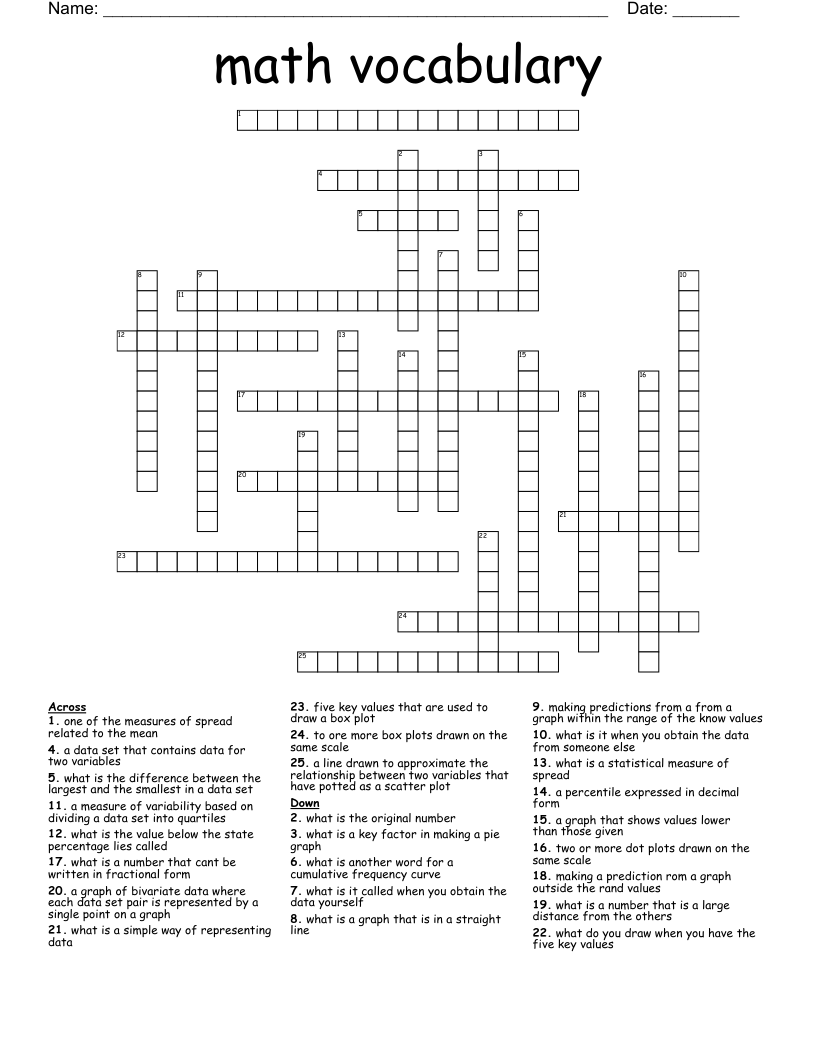
This printable crossword puzzle on the topic of Statistics & Probability has 25 clues. Answers range from 5 to 18 letters long. This crossword is also available to download as a Microsoft Word document or a PDF.
Description
what is it called when you obtain the data yourself
what is it when you obtain the data from someone else
what is another word for a cumulative frequency curve
what is the value below the state percentage lies called
what do you draw when you have the five key values
what is a key factor in making a pie graph
what is a number that is a large distance from the others
a percentile expressed in decimal form
what is the difference between the largest and the smallest in a data set
what is a simple way of representing data
a measure of variability based on dividing a data set into quartiles
a graph that shows values lower than those given
a graph of bivariate data where each data set pair is represented by a single point on a graph
five key values that are used to draw a box plot
to ore more box plots drawn on the same scale
two or more dot plots drawn on the same scale
what is a statistical measure of spread
a data set that contains data for two variables
one of the measures of spread related to the mean
a line drawn to approximate the relationship between two variables that have potted as a scatter plot
making predictions from a from a graph within the range of the know values
making a prediction rom a graph outside the rand values
what is the original number
what is a number that cant be written in fractional form
what is a graph that is in a straight line