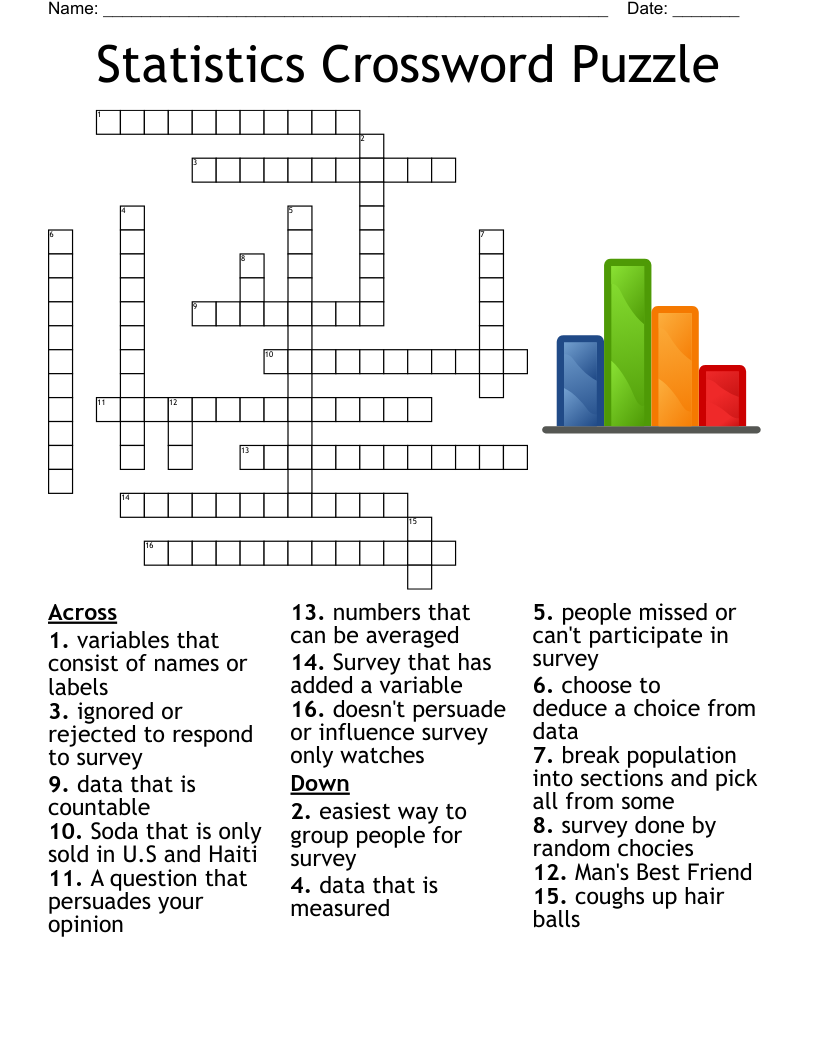
Statistics Chapter 1 Vocabulary Crossword
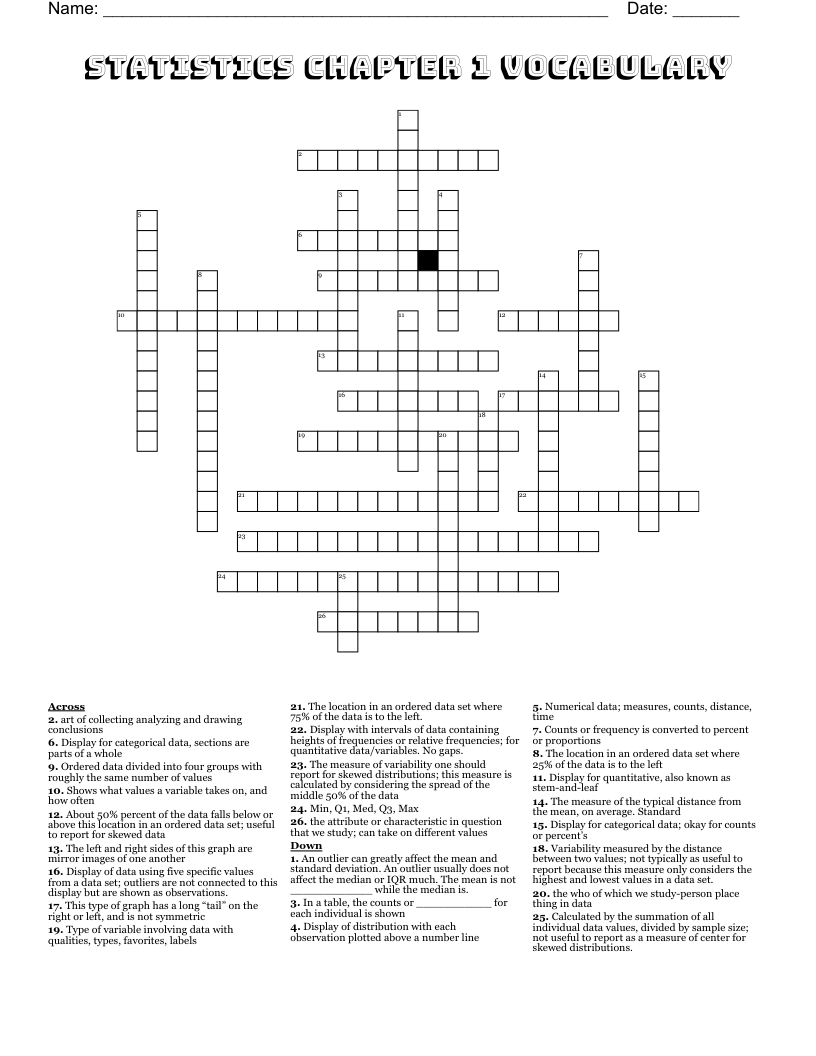
This printable crossword puzzle on the topic of Statistics & Probability has 26 clues. Answers range from 4 to 18 letters long. This crossword is also available to download as a Microsoft Word document or a PDF.
Description
art of collecting analyzing and drawing conclusions
the who of which we study-person place thing in data
the attribute or characteristic in question that we study; can take on different values
Type of variable involving data with qualities, types, favorites, labels
Numerical data; measures, counts, distance, time
Shows what values a variable takes on, and how often
In a table, the counts or ___________ for each individual is shown
Counts or frequency is converted to percent or proportions
Display for categorical data; okay for counts or percent’s
Display for categorical data, sections are parts of a whole
Display of distribution with each observation plotted above a number line
The left and right sides of this graph are mirror images of one another
This type of graph has a long “tail” on the right or left, and is not symmetric
Display for quantitative, also known as stem-and-leaf
Display with intervals of data containing heights of frequencies or relative frequencies; for quantitative data/variables. No gaps.
About 50% percent of the data falls below or above this location in an ordered data set; useful to report for skewed data
Calculated by the summation of all individual data values, divided by sample size; not useful to report as a measure of center for skewed distributions.
An outlier can greatly affect the mean and standard deviation. An outlier usually does not affect the median or IQR much. The mean is not ____________ while the median is.
Variability measured by the distance between two values; not typically as useful to report because this measure only considers the highest and lowest values in a data set.
The measure of the typical distance from the mean, on average. Standard
Ordered data divided into four groups with roughly the same number of values
The location in an ordered data set where 25% of the data is to the left
The location in an ordered data set where 75% of the data is to the left.
The measure of variability one should report for skewed distributions; this measure is calculated by considering the spread of the middle 50% of the data
Min, Q1, Med, Q3, Max
Display of data using five specific values from a data set; outliers are not connected to this display but are shown as observations.