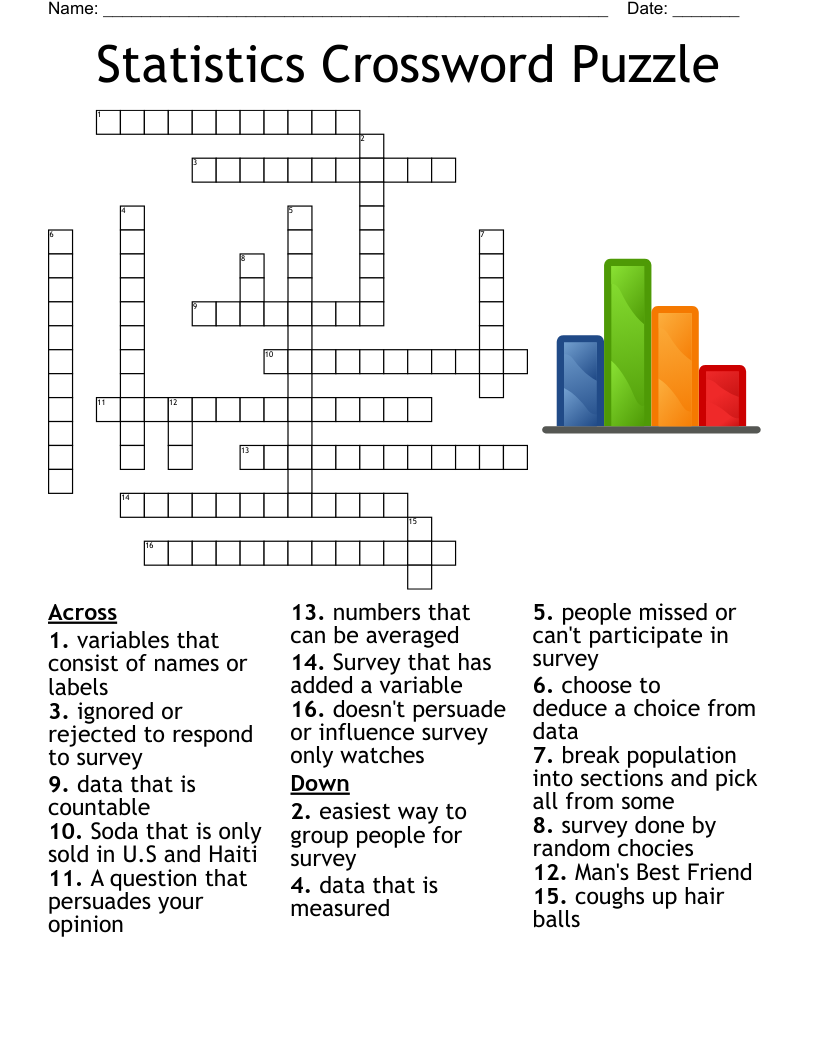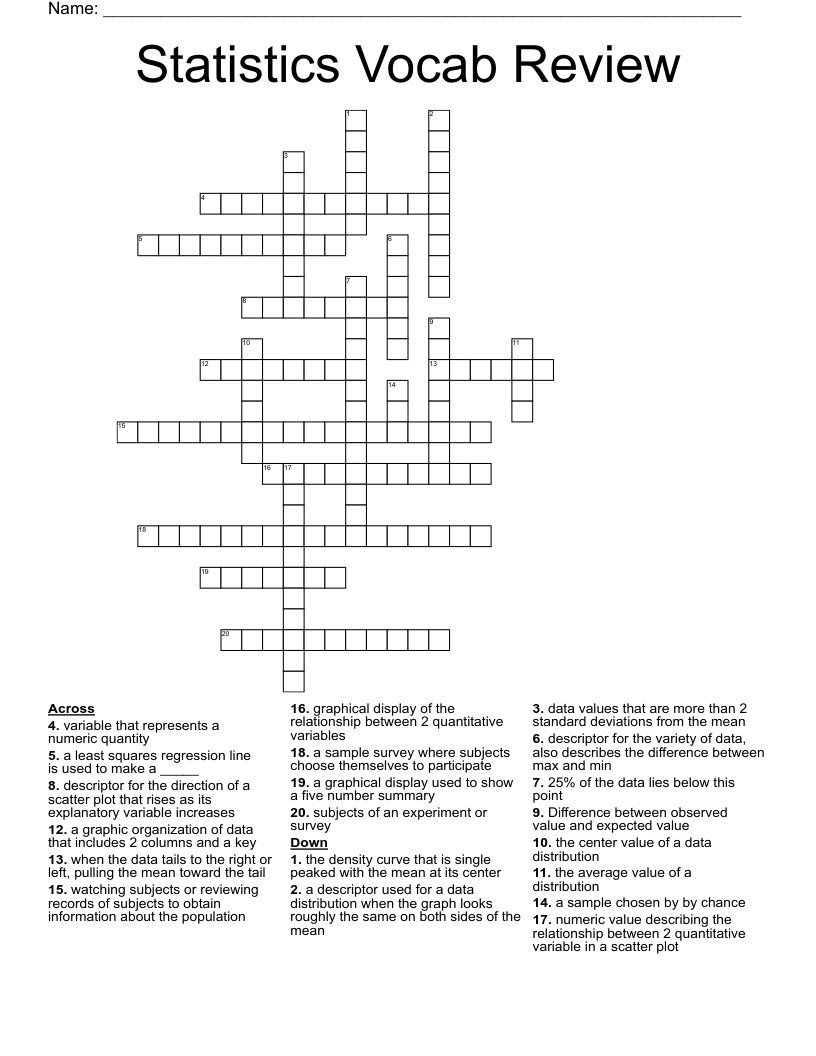
Statistics Vocab Review Crossword
This printable crossword puzzle on the topic of Statistics & Probability has 20 clues. Answers range from 3 to 18 letters long. This crossword is also available to download as a Microsoft Word document or a PDF.
Description
Difference between observed value and expected value
watching subjects or reviewing records of subjects to obtain information about the population
subjects of an experiment or survey
variable that represents a numeric quantity
a graphic organization of data that includes 2 columns and a key
descriptor for the variety of data, also describes the difference between max and min
data values that are more than 2 standard deviations from the mean
the average value of a distribution
the center value of a data distribution
a descriptor used for a data distribution when the graph looks roughly the same on both sides of the mean
when the data tails to the right or left, pulling the mean toward the tail
25% of the data lies below this point
a graphical display used to show a five number summary
the density curve that is single peaked with the mean at its center
graphical display of the relationship between 2 quantitative variables
descriptor for the direction of a scatter plot that rises as its explanatory variable increases
numeric value describing the relationship between 2 quantitative variable in a scatter plot
a least squares regression line is used to make a _____
a sample survey where subjects choose themselves to participate
a sample chosen by by chance