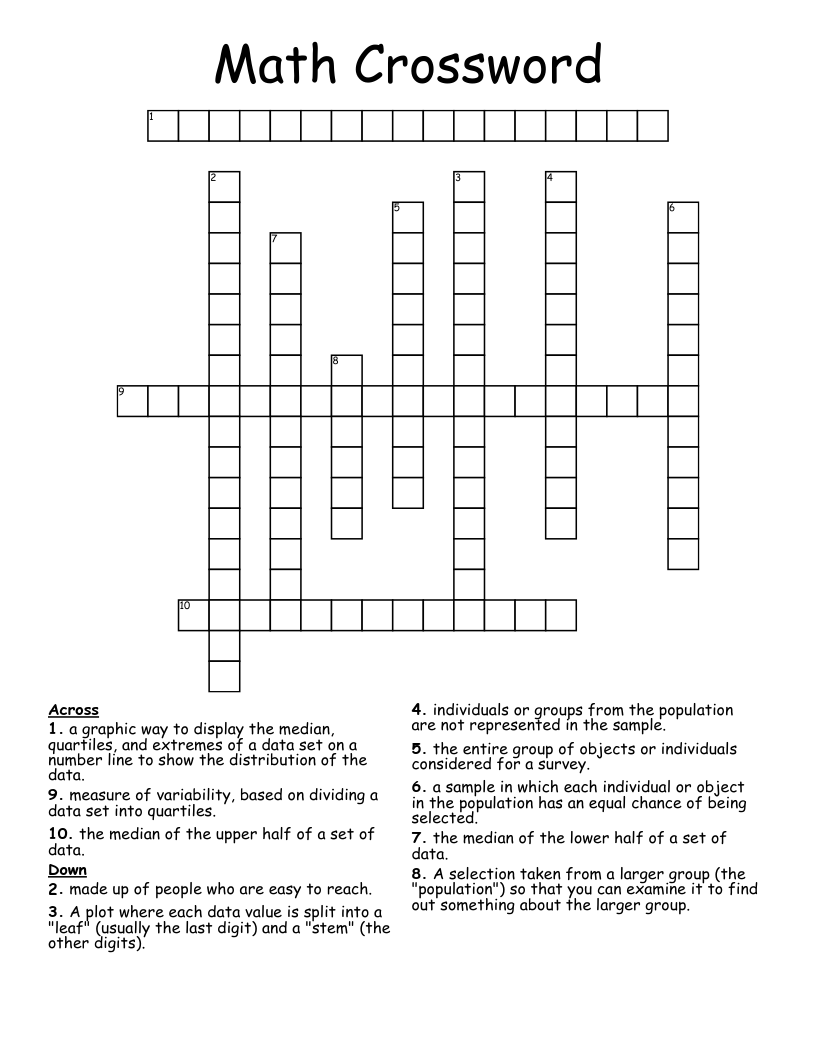
Math Crossword
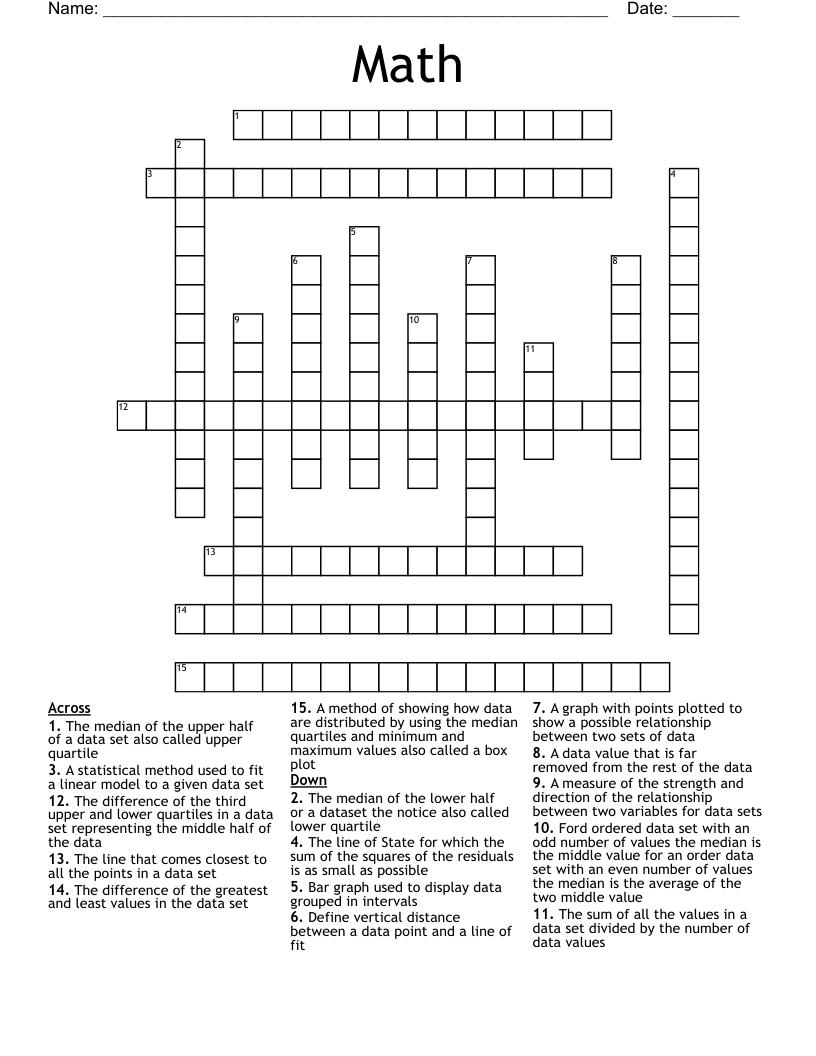
This printable crossword puzzle on the topic of Statistics & Probability has 15 clues. Answers range from 4 to 19 letters long. This crossword is also available to download as a Microsoft Word document or a PDF.
Description
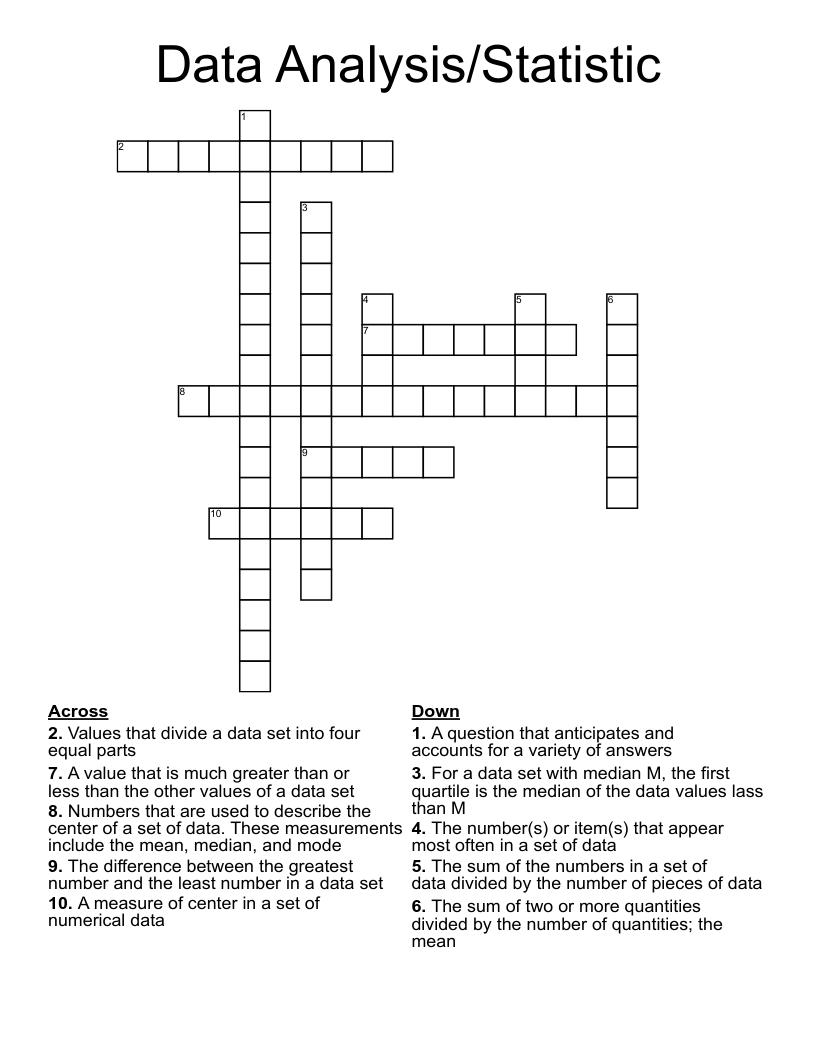
A method of showing how data are distributed by using the median quartiles and minimum and maximum values also called a box plot
A measure of the strength and direction of the relationship between two variables for data sets
The median of the lower half or a dataset the notice also called lower quartile
Bar graph used to display data grouped in intervals
The difference of the third upper and lower quartiles in a data set representing the middle half of the data
The line of State for which the sum of the squares of the residuals is as small as possible
The line that comes closest to all the points in a data set
A statistical method used to fit a linear model to a given data set
The sum of all the values in a data set divided by the number of data values
Ford ordered data set with an odd number of values the median is the middle value for an order data set with an even number of values the median is the average of the two middle value
A data value that is far removed from the rest of the data
The difference of the greatest and least values in the data set
Define vertical distance between a data point and a line of fit
A graph with points plotted to show a possible relationship between two sets of data
The median of the upper half of a data set also called upper quartile