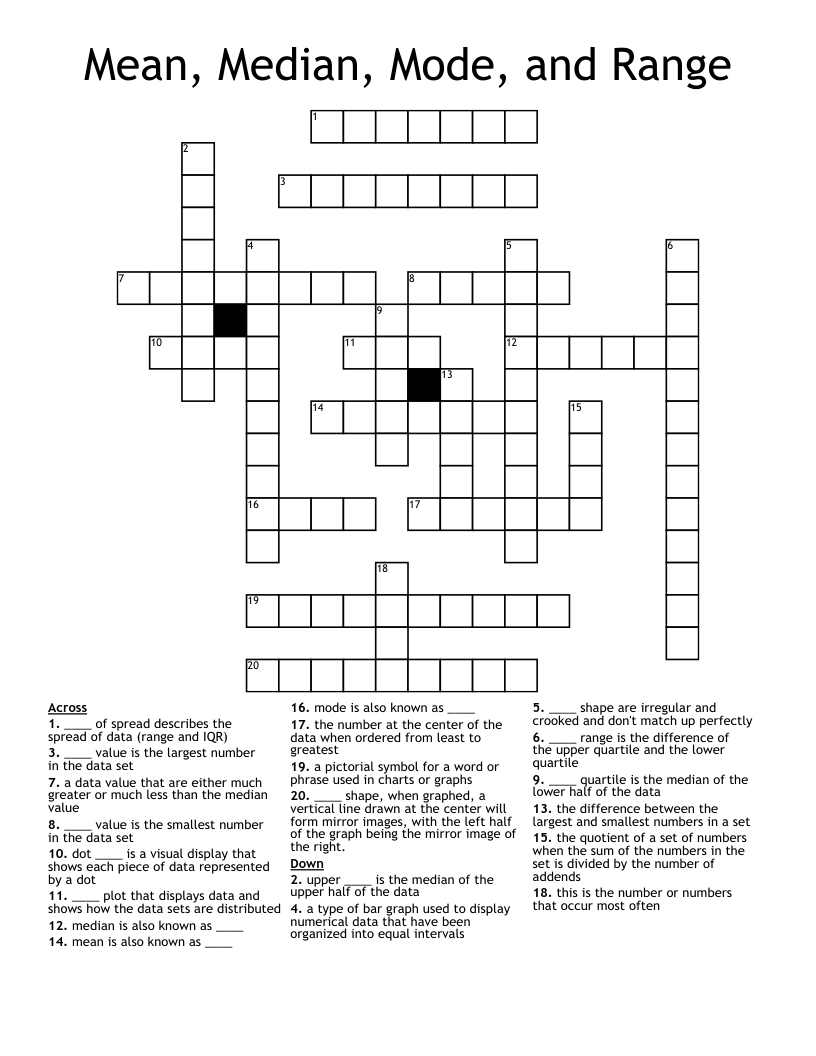
Mean, Median, Mode, and Range Crossword
This printable crossword puzzle on the topic of Statistics & Probability has 20 clues. Answers range from 3 to 13 letters long. This crossword is also available to download as a Microsoft Word document or a PDF.
Description
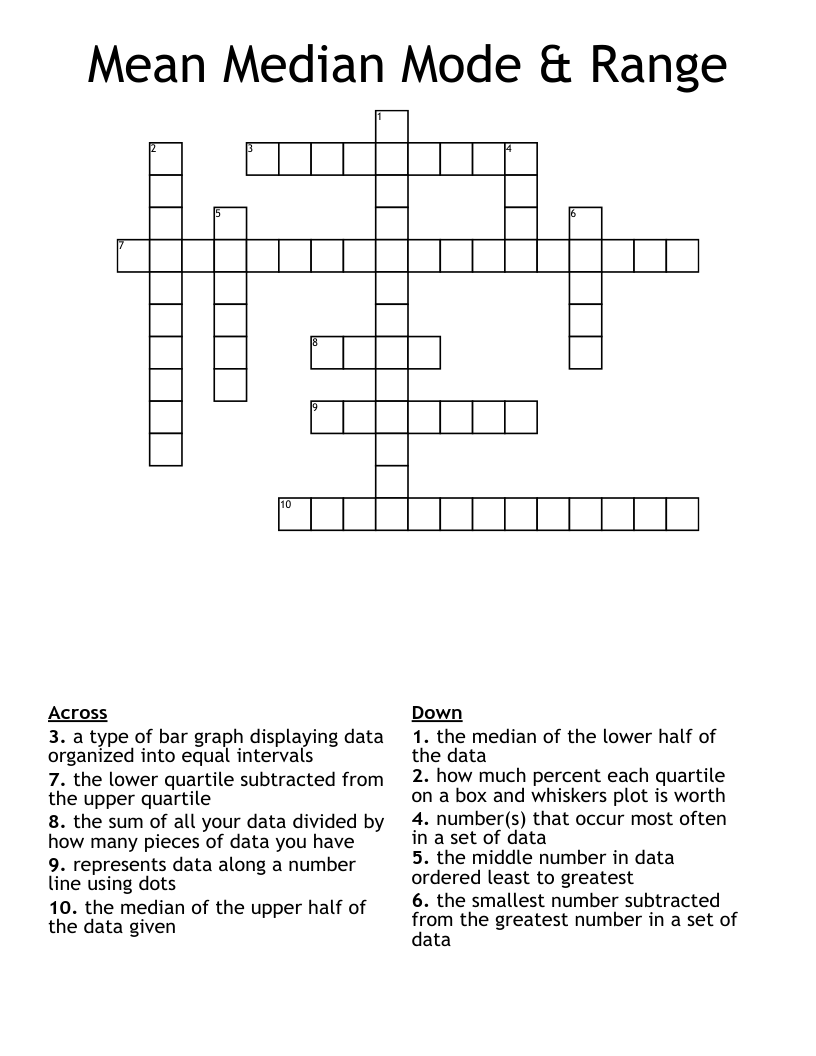
the number at the center of the data when ordered from least to greatest
____ plot that displays data and shows how the data sets are distributed
this is the number or numbers that occur most often
a type of bar graph used to display numerical data that have been organized into equal intervals
the difference between the largest and smallest numbers in a set
upper ____ is the median of the upper half of the data
____ range is the difference of the upper quartile and the lower quartile
the quotient of a set of numbers when the sum of the numbers in the set is divided by the number of addends
____ value is the smallest number in the data set
____ quartile is the median of the lower half of the data
____ of spread describes the spread of data (range and IQR)
____ value is the largest number in the data set
____ shape are irregular and crooked and don't match up perfectly
____ shape, when graphed, a vertical line drawn at the center will form mirror images, with the left half of the graph being the mirror image of the right.
dot ____ is a visual display that shows each piece of data represented by a dot
a data value that are either much greater or much less than the median value
a pictorial symbol for a word or phrase used in charts or graphs
mean is also known as ____
mode is also known as ____
median is also known as ____