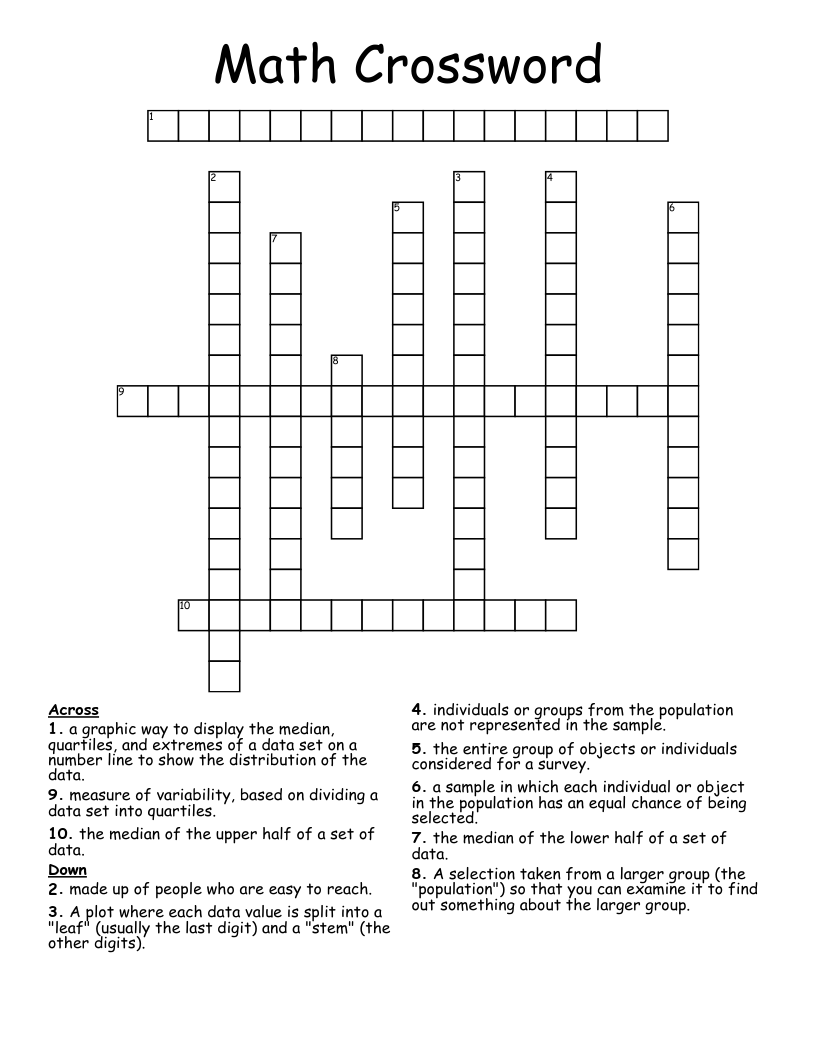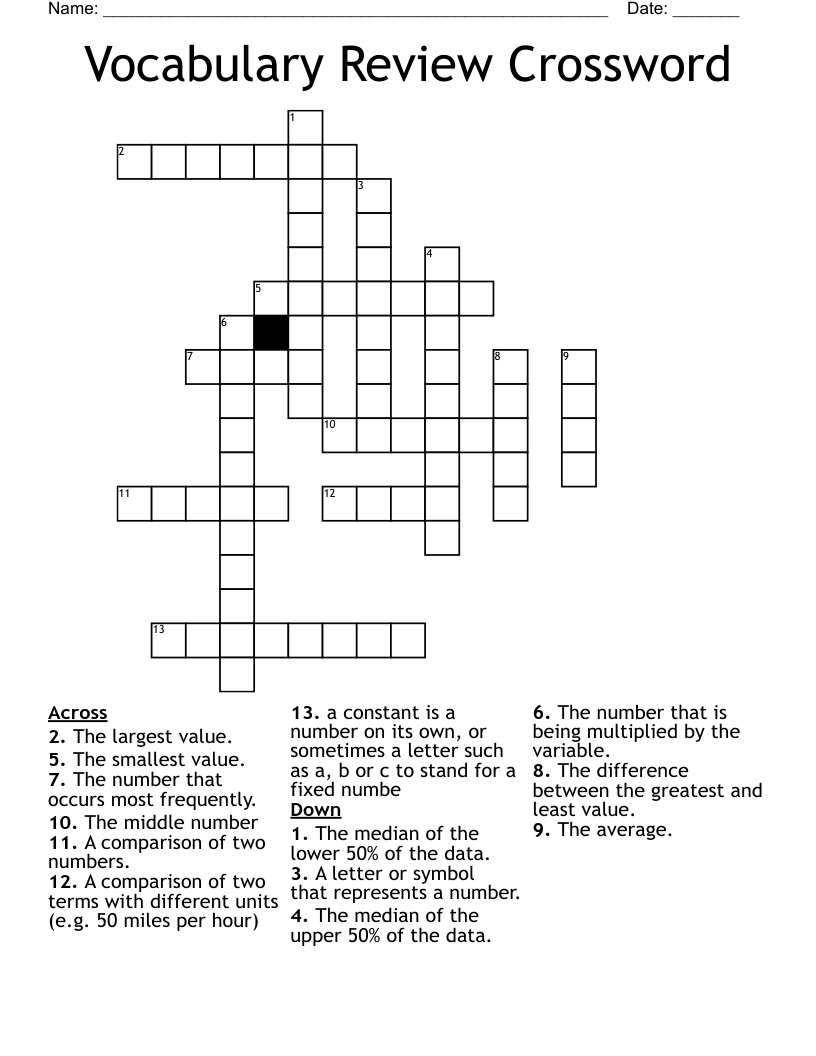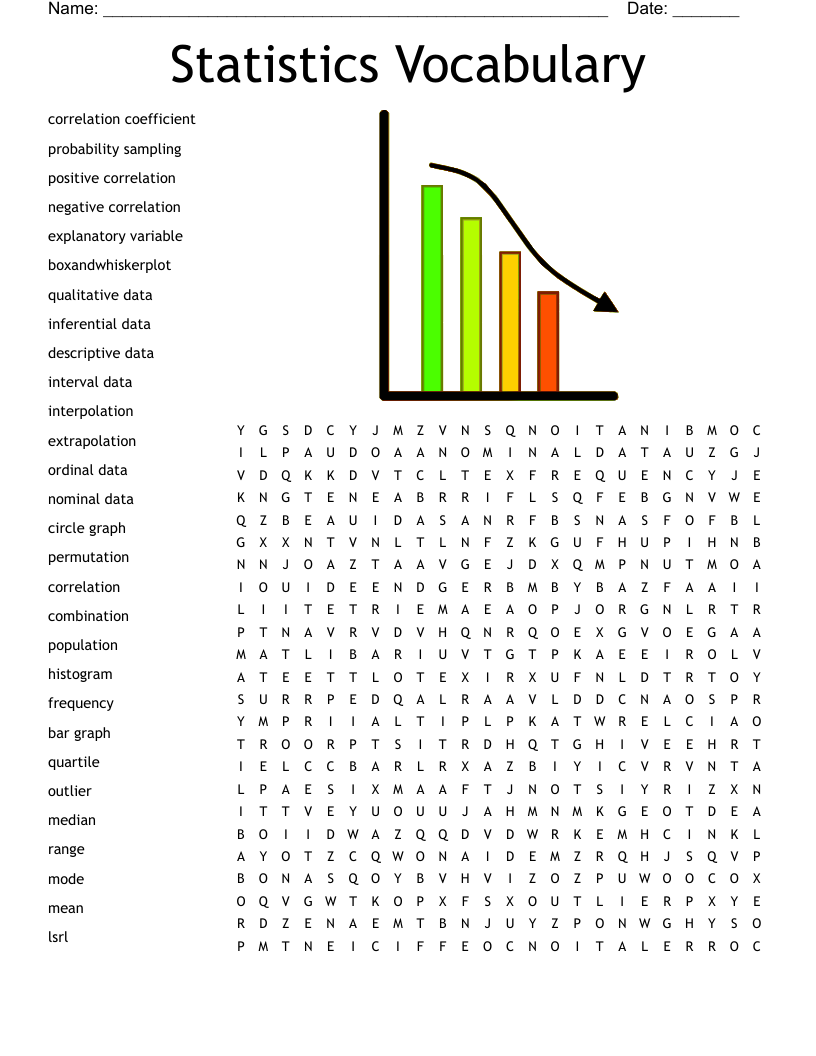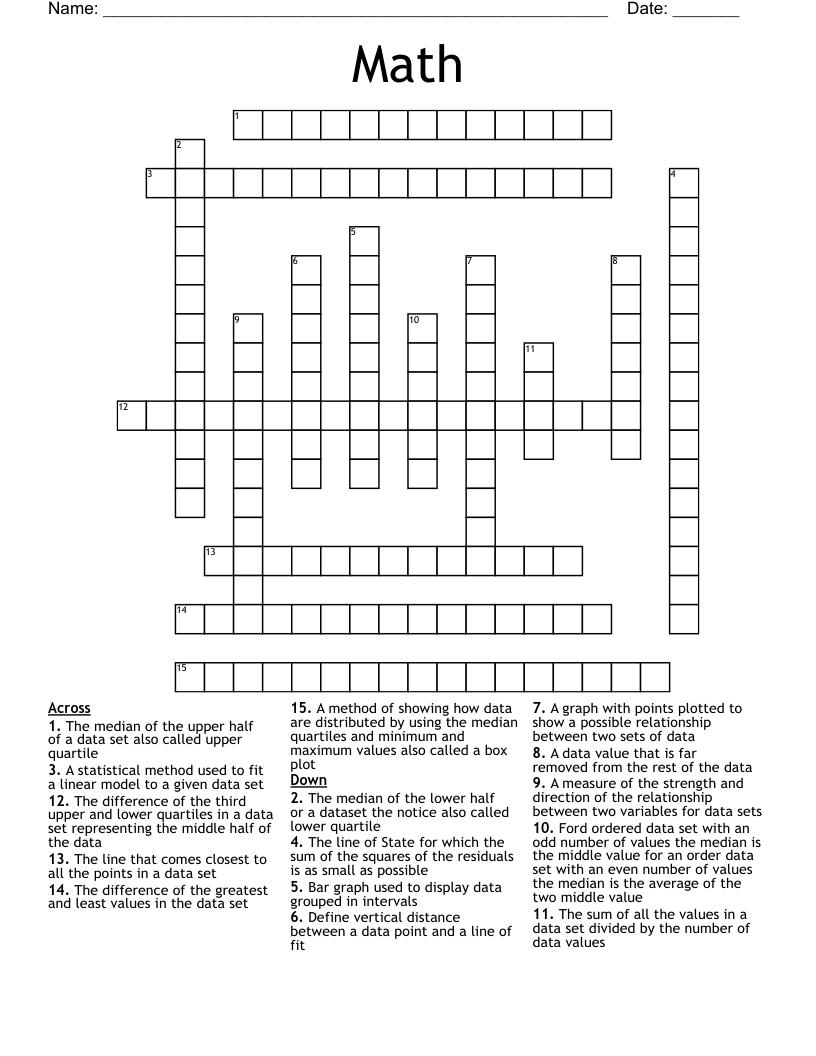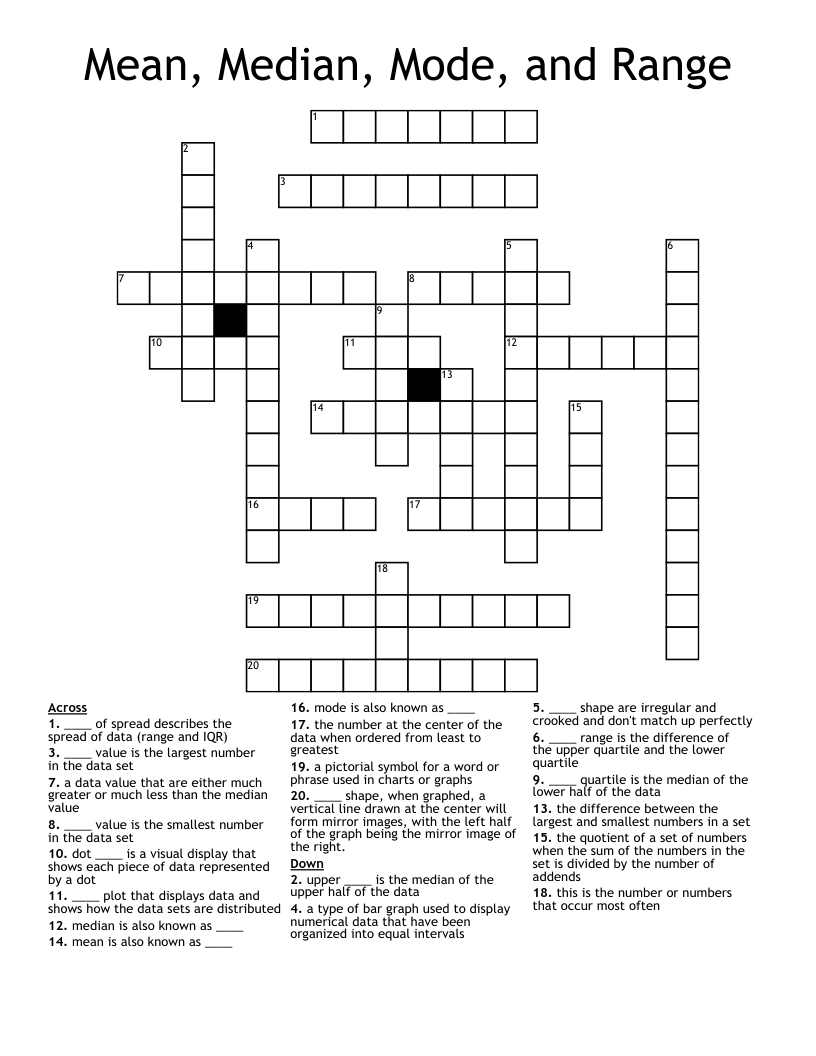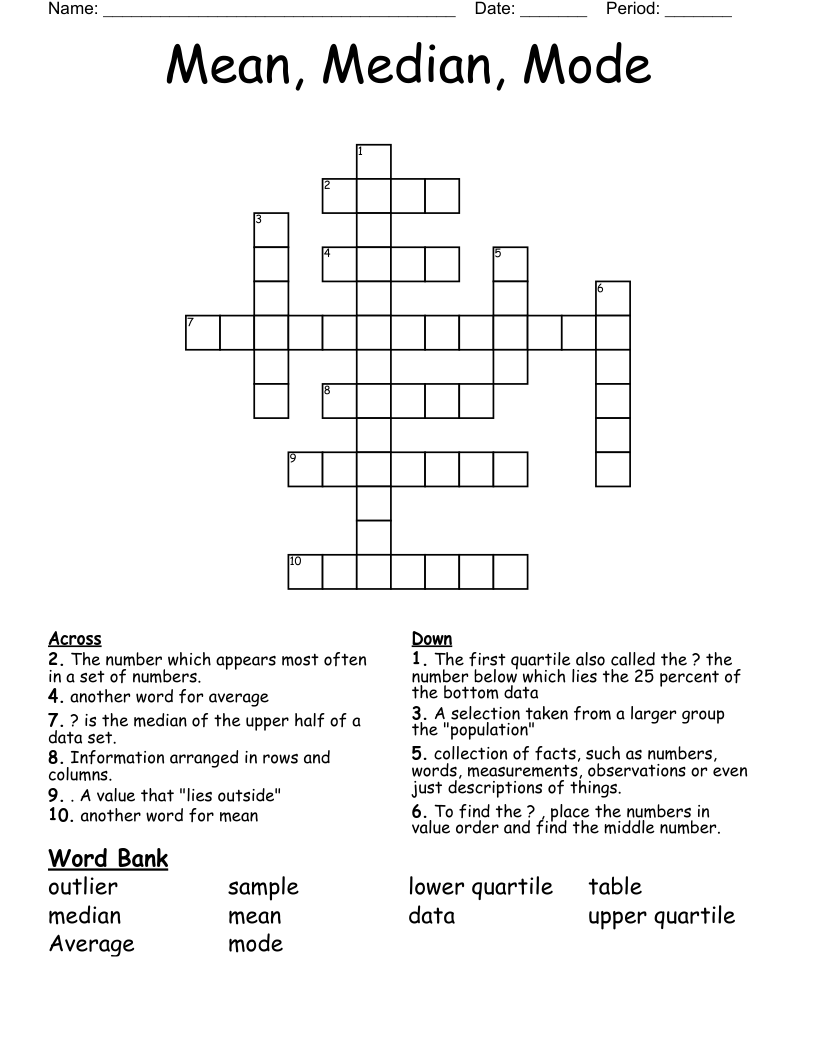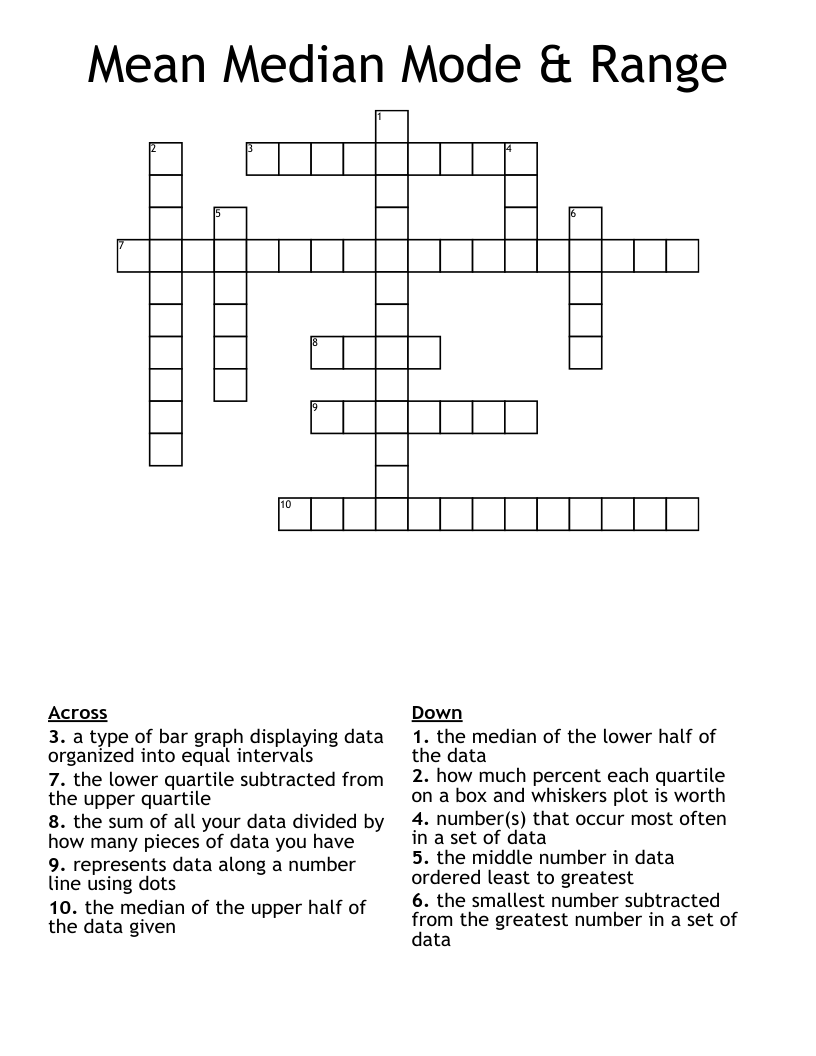
Mean Median Mode & Range Crossword
This printable crossword puzzle on the topic of Statistics & Probability has 10 clues. Answers range from 4 to 18 letters long. This crossword is also available to download as a Microsoft Word document or a PDF.
Description
the sum of all your data divided by how many pieces of data you have
a type of bar graph displaying data organized into equal intervals
the middle number in data ordered least to greatest
the smallest number subtracted from the greatest number in a set of data
the median of the lower half of the data
number(s) that occur most often in a set of data
the median of the upper half of the data given
the lower quartile subtracted from the upper quartile
how much percent each quartile on a box and whiskers plot is worth
represents data along a number line using dots