Math Vocabulary Crossword
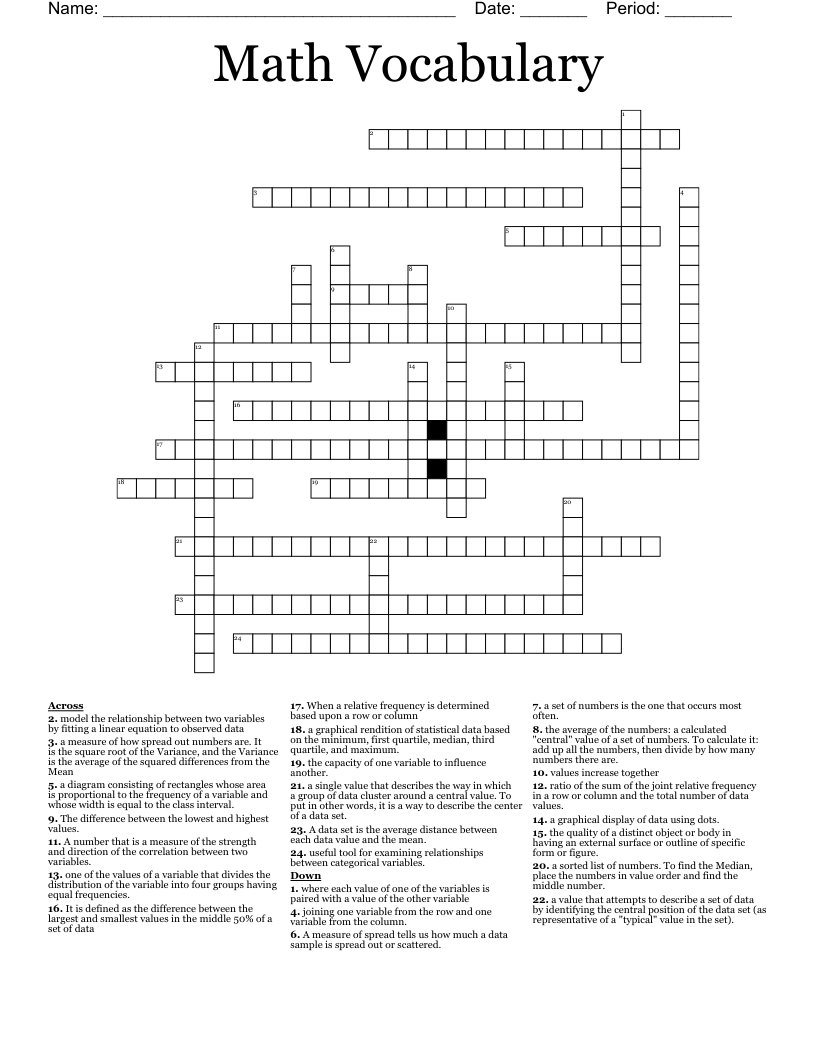
This printable crossword puzzle on the topic of Statistics & Probability has 24 clues. Answers range from 4 to 28 letters long. This crossword is also available to download as a Microsoft Word document or a PDF.
Description
the average of the numbers: a calculated "central" value of a set of numbers. To calculate it: add up all the numbers, then divide by how many numbers there are.
a sorted list of numbers. To find the Median, place the numbers in value order and find the middle number.
a set of numbers is the one that occurs most often.
a value that attempts to describe a set of data by identifying the central position of the data set (as representative of a "typical" value in the set).
a single value that describes the way in which a group of data cluster around a central value. To put in other words, it is a way to describe the center of a data set.
A measure of spread tells us how much a data sample is spread out or scattered.
It is defined as the difference between the largest and smallest values in the middle 50% of a set of data
A data set is the average distance between each data value and the mean.
a measure of how spread out numbers are. It is the square root of the Variance, and the Variance is the average of the squared differences from the Mean
The difference between the lowest and highest values.
one of the values of a variable that divides the distribution of the variable into four groups having equal frequencies.
the quality of a distinct object or body in having an external surface or outline of specific form or figure.
a graphical display of data using dots.
a graphical rendition of statistical data based on the minimum, first quartile, median, third quartile, and maximum.
a diagram consisting of rectangles whose area is proportional to the frequency of a variable and whose width is equal to the class interval.
useful tool for examining relationships between categorical variables.
joining one variable from the row and one variable from the column.
ratio of the sum of the joint relative frequency in a row or column and the total number of data values.
When a relative frequency is determined based upon a row or column
A number that is a measure of the strength and direction of the correlation between two variables.
model the relationship between two variables by fitting a linear equation to observed data
values increase together
the capacity of one variable to influence another.
where each value of one of the variables is paired with a value of the other variable