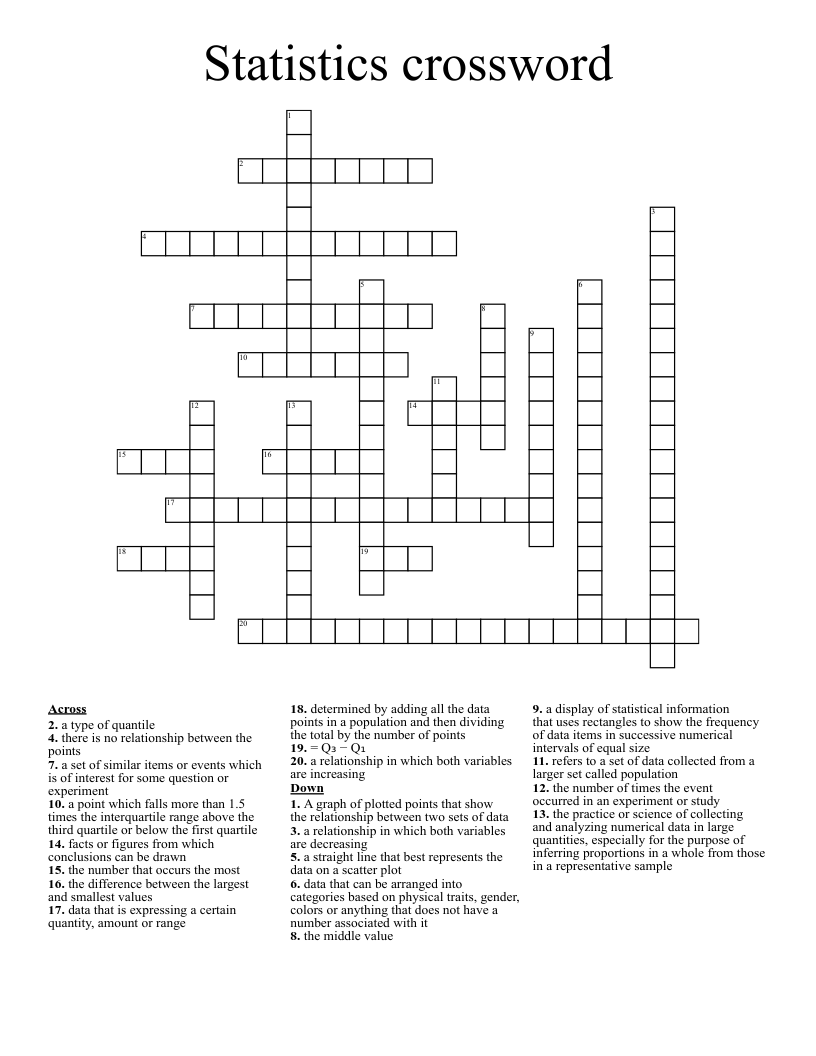
Statistics crossword
This printable crossword puzzle has 20 clues. Answers range from 3 to 19 letters long. This crossword is also available to download as a Microsoft Word document or a PDF.
Description
facts or figures from which conclusions can be drawn
determined by adding all the data points in a population and then dividing the total by the number of points
the middle value
the number that occurs the most
the difference between the largest and smallest values
a point which falls more than 1.5 times the interquartile range above the third quartile or below the first quartile
a type of quantile
= Q₃ − Q₁
the number of times the event occurred in an experiment or study
a set of similar items or events which is of interest for some question or experiment
data that is expressing a certain quantity, amount or range
data that can be arranged into categories based on physical traits, gender, colors or anything that does not have a number associated with it
a display of statistical information that uses rectangles to show the frequency of data items in successive numerical intervals of equal size
a relationship in which both variables are increasing
a relationship in which both variables are decreasing
there is no relationship between the points
refers to a set of data collected from a larger set called population
a straight line that best represents the data on a scatter plot
A graph of plotted points that show the relationship between two sets of data
the practice or science of collecting and analyzing numerical data in large quantities, especially for the purpose of inferring proportions in a whole from those in a representative sample