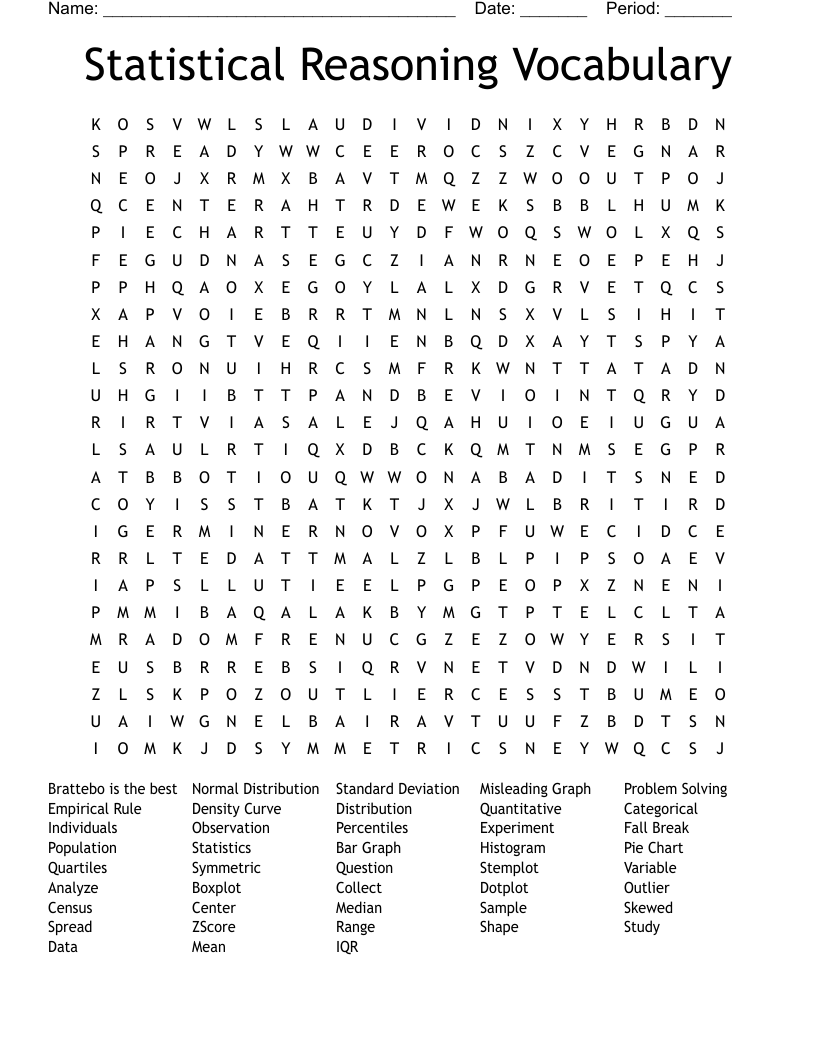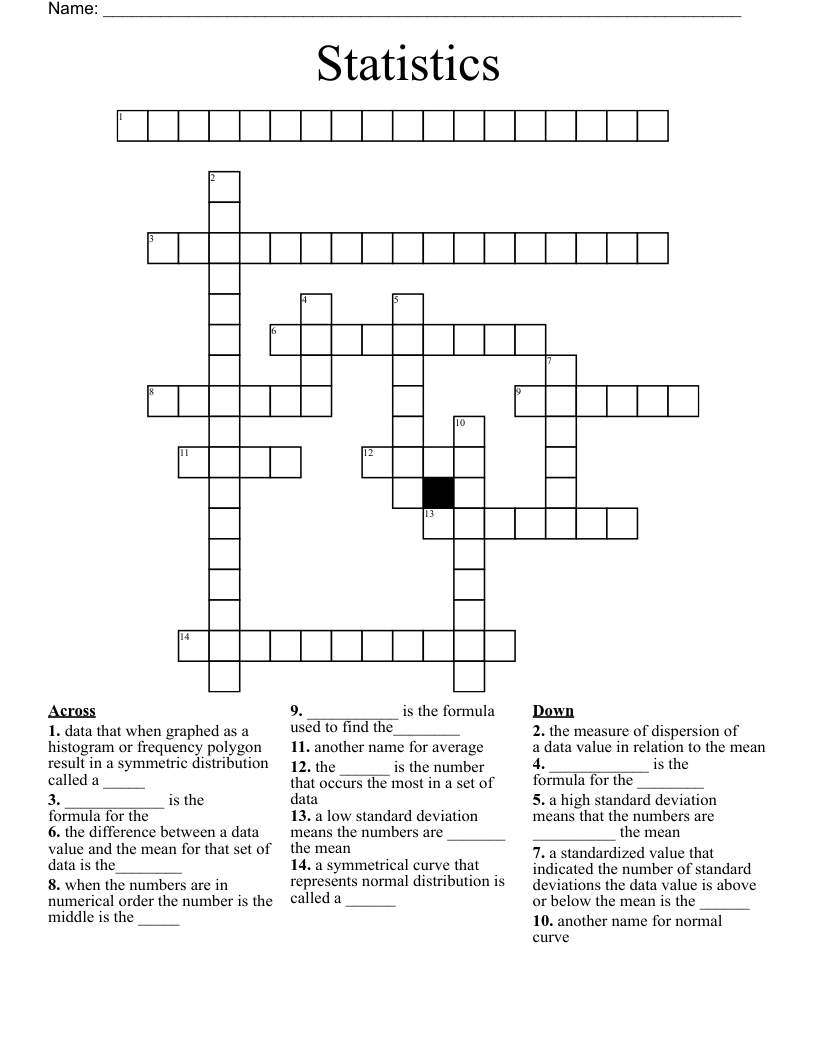
vocabulary word puzzle Crossword
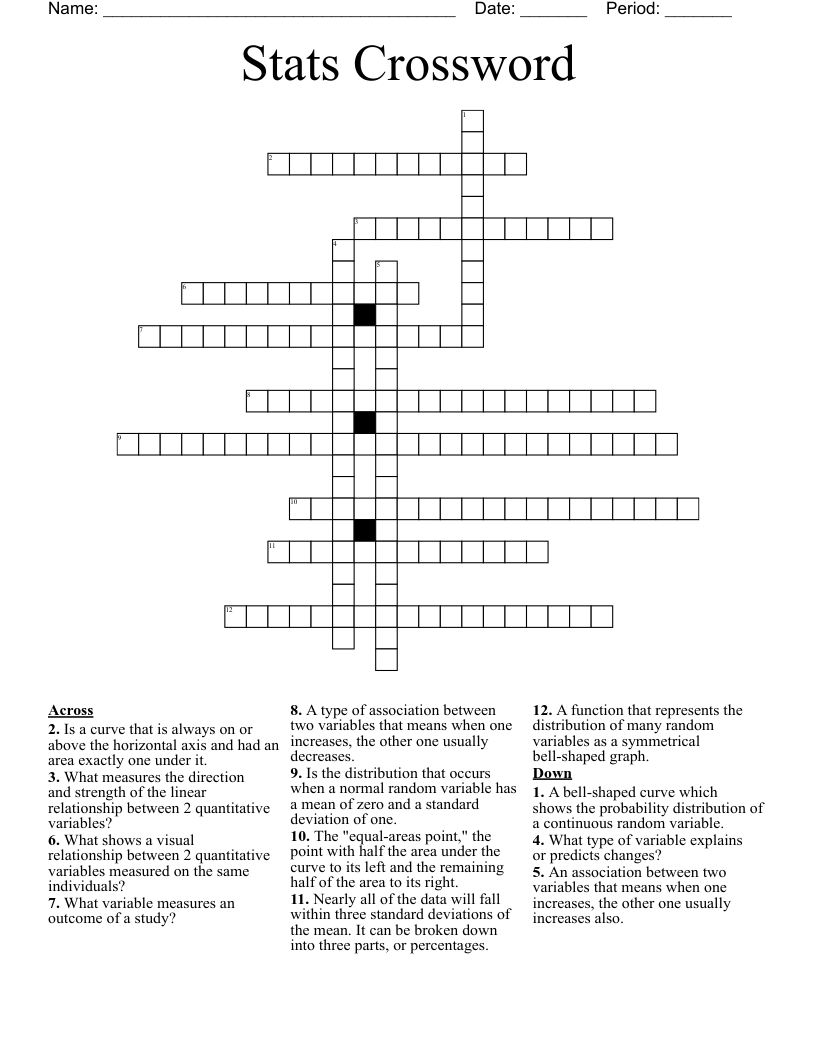
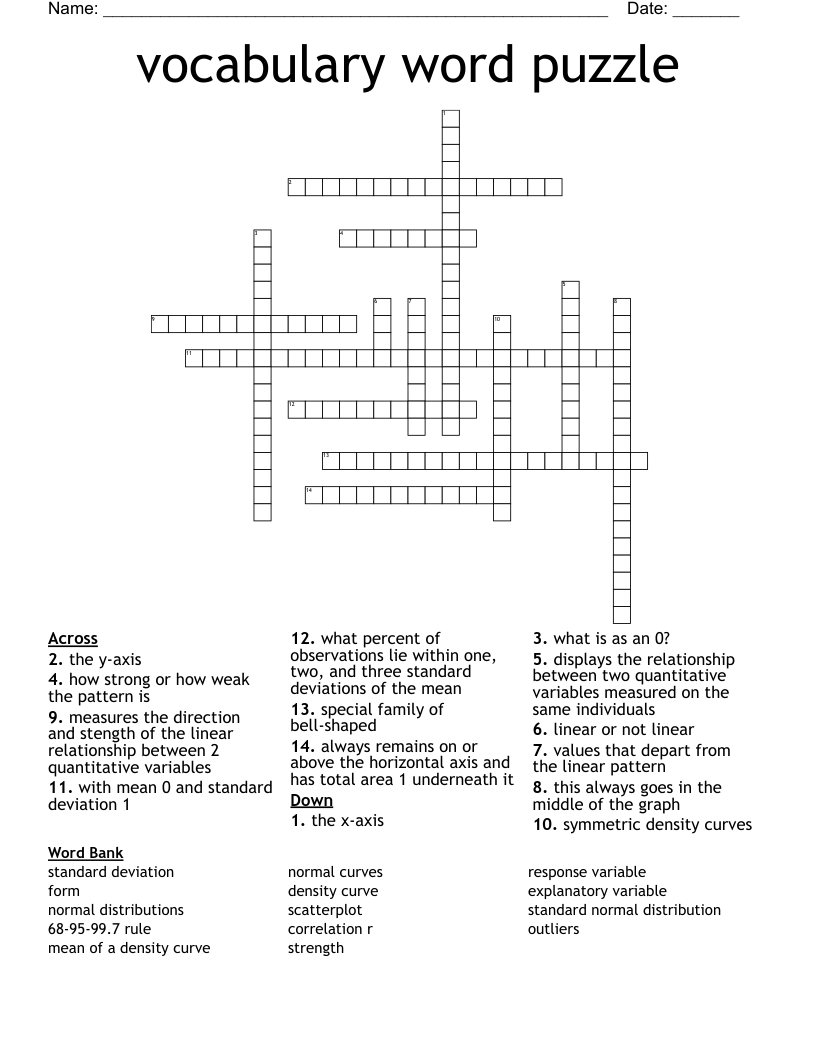
This printable crossword puzzle on the topic of Statistics & Probability has 14 clues. Answers range from 4 to 26 letters long. This crossword is also available to download as a Microsoft Word document or a PDF.
Description
displays the relationship between two quantitative variables measured on the same individuals
the x-axis
the y-axis
measures the direction and stength of the linear relationship between 2 quantitative variables
values that depart from the linear pattern
how strong or how weak the pattern is
linear or not linear
always remains on or above the horizontal axis and has total area 1 underneath it
special family of bell-shaped
symmetric density curves
what percent of observations lie within one, two, and three standard deviations of the mean
with mean 0 and standard deviation 1
this always goes in the middle of the graph
what is as an 0?