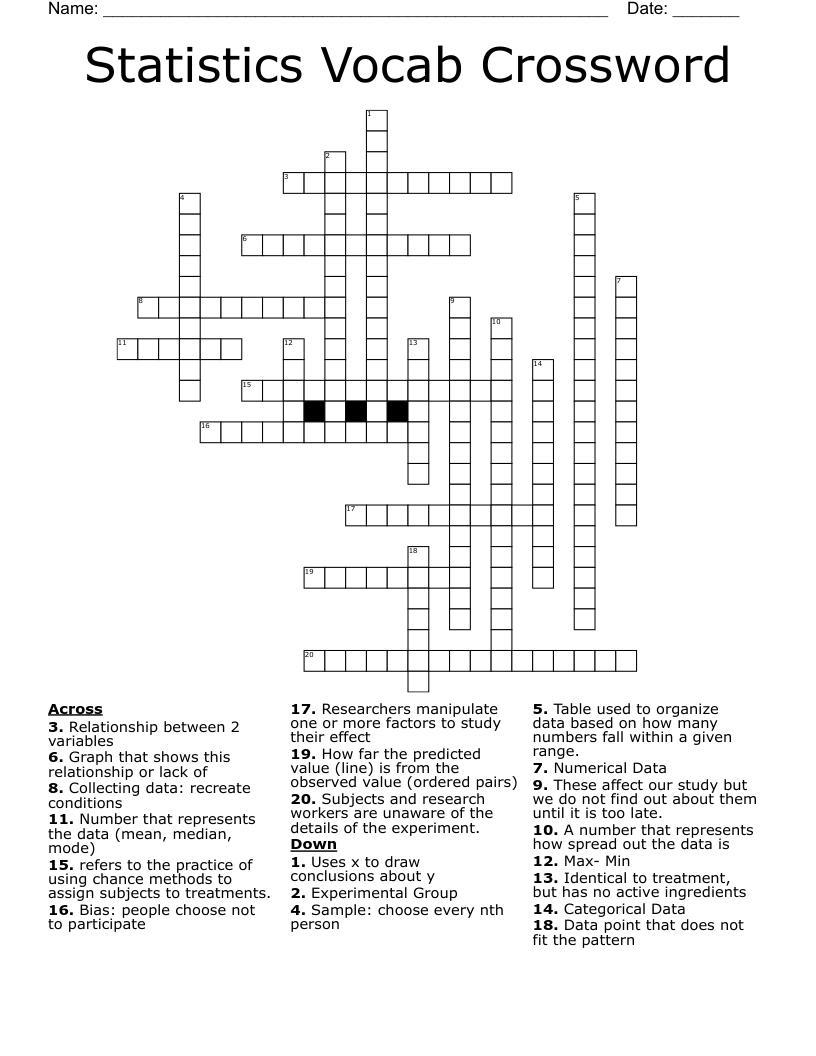
Statistics Vocab Crossword
This printable crossword puzzle on the topic of Statistics & Probability has 20 clues. Answers range from 5 to 21 letters long. This crossword is also available to download as a Microsoft Word document or a PDF.
Description
Numerical Data
Categorical Data
Sample: choose every nth person
Collecting data: recreate conditions
Bias: people choose not to participate
A number that represents how spread out the data is
Max- Min
Relationship between 2 variables
Graph that shows this relationship or lack of
Uses x to draw conclusions about y
How far the predicted value (line) is from the observed value (ordered pairs)
Data point that does not fit the pattern
These affect our study but we do not find out about them until it is too late.
Researchers manipulate one or more factors to study their effect
refers to the practice of using chance methods to assign subjects to treatments.
Experimental Group
Subjects and research workers are unaware of the details of the experiment.
Identical to treatment, but has no active ingredients
Number that represents the data (mean, median, mode)
Table used to organize data based on how many numbers fall within a given range.