Unit 1 Vocabulary Crossword
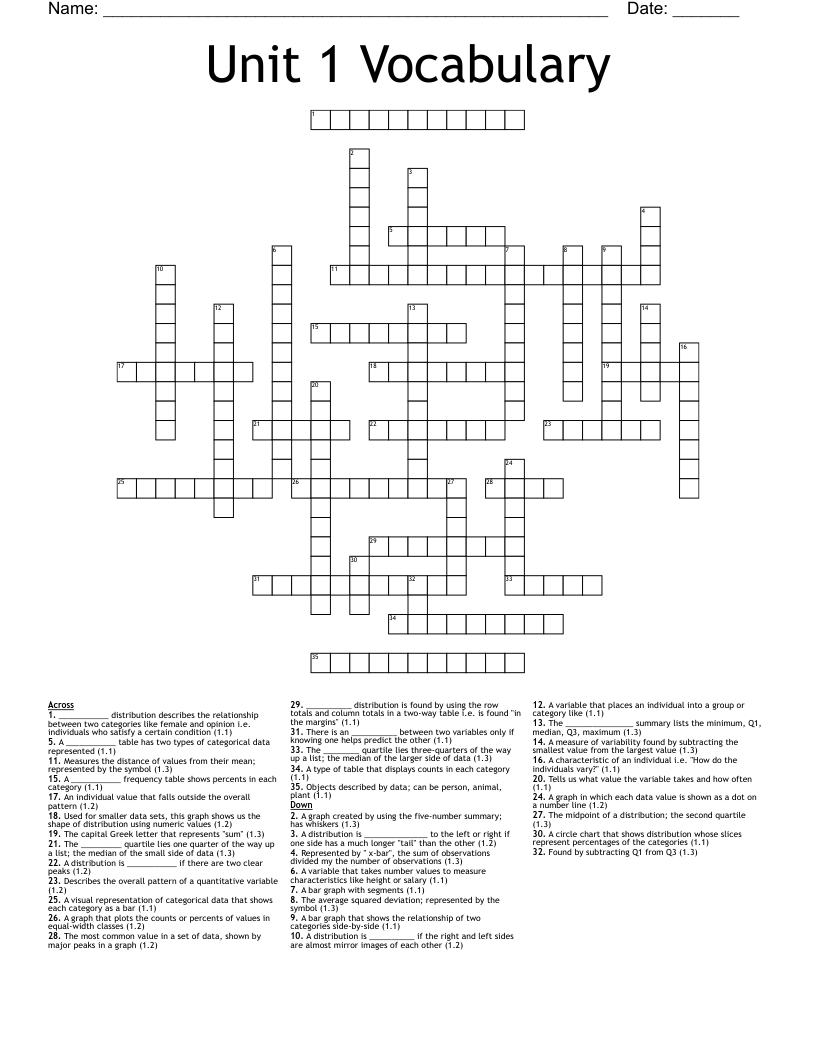
This printable crossword puzzle on the topic of Statistics & Probability has 35 clues. Answers range from 3 to 17 letters long. This crossword is also available to download as a Microsoft Word document or a PDF.
Description
Objects described by data; can be person, animal, plant (1.1)
A characteristic of an individual i.e. "How do the individuals vary?" (1.1)
A variable that places an individual into a group or category like (1.1)
A variable that takes number values to measure characteristics like height or salary (1.1)
Tells us what value the variable takes and how often (1.1)
A type of table that displays counts in each category (1.1)
A ___________ frequency table shows percents in each category (1.1)
A circle chart that shows distribution whose slices represent percentages of the categories (1.1)
A visual representation of categorical data that shows each category as a bar (1.1)
A ___________ table has two types of categorical data represented (1.1)
__________ distribution is found by using the row totals and column totals in a two-way table i.e. is found "in the margins" (1.1)
___________ distribution describes the relationship between two categories like female and opinion i.e. individuals who satisfy a certain condition (1.1)
A bar graph with segments (1.1)
A bar graph that shows the relationship of two categories side-by-side (1.1)
There is an __________ between two variables only if knowing one helps predict the other (1.1)
A graph in which each data value is shown as a dot on a number line (1.2)
Used for smaller data sets, this graph shows us the shape of distribution using numeric values (1.2)
A graph that plots the counts or percents of values in equal-width classes (1.2)
Describes the overall pattern of a quantitative variable (1.2)
An individual value that falls outside the overall pattern (1.2)
A distribution is __________ if the right and left sides are almost mirror images of each other (1.2)
A distribution is ______________ to the left or right if one side has a much longer "tail" than the other (1.2)
A distribution is ___________ if there are two clear peaks (1.2)
The most common value in a set of data, shown by major peaks in a graph (1.2)
Represented by " x-bar", the sum of observations divided my the number of observations (1.3)
The capital Greek letter that represents "sum" (1.3)
The midpoint of a distribution; the second quartile (1.3)
A measure of variability found by subtracting the smallest value from the largest value (1.3)
The _________ quartile lies one quarter of the way up a list; the median of the small side of data (1.3)
The ________ quartile lies three-quarters of the way up a list; the median of the larger side of data (1.3)
Found by subtracting Q1 from Q3 (1.3)
The _______________ summary lists the minimum, Q1, median, Q3, maximum (1.3)
A graph created by using the five-number summary; has whiskers (1.3)
Measures the distance of values from their mean; represented by the symbol (1.3)
The average squared deviation; represented by the symbol (1.3)