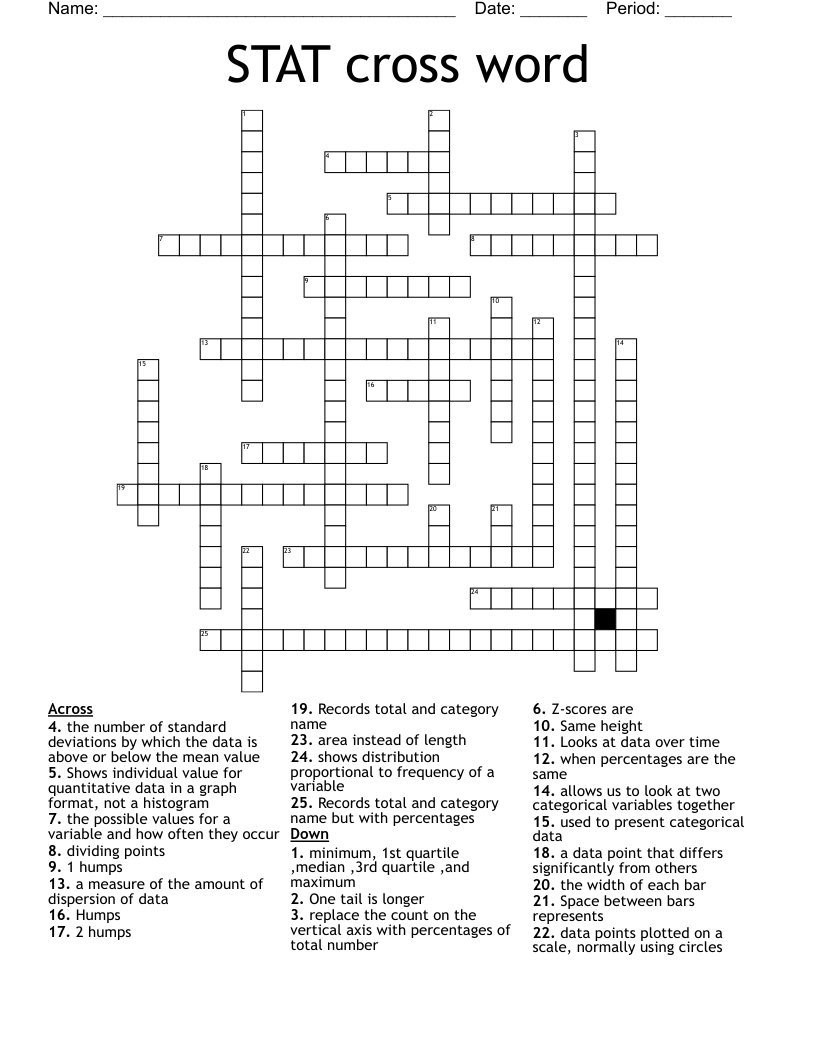
STAT cross word
This printable crossword puzzle on the topic of Statistics & Probability has 25 clues. Answers range from 3 to 26 letters long. This crossword is also available to download as a Microsoft Word document or a PDF.
Description
Looks at data over time
a data point that differs significantly from others
the number of standard deviations by which the data is above or below the mean value
a measure of the amount of dispersion of data
Z-scores are
Shows individual value for quantitative data in a graph format, not a histogram
data points plotted on a scale, normally using circles
shows distribution proportional to frequency of a variable
used to present categorical data
the width of each bar
Space between bars represents
replace the count on the vertical axis with percentages of total number
Same height
One tail is longer
1 humps
Humps
2 humps
dividing points
minimum, 1st quartile ,median ,3rd quartile ,and maximum
Records total and category name
Records total and category name but with percentages
the possible values for a variable and how often they occur
area instead of length
when percentages are the same
allows us to look at two categorical variables together