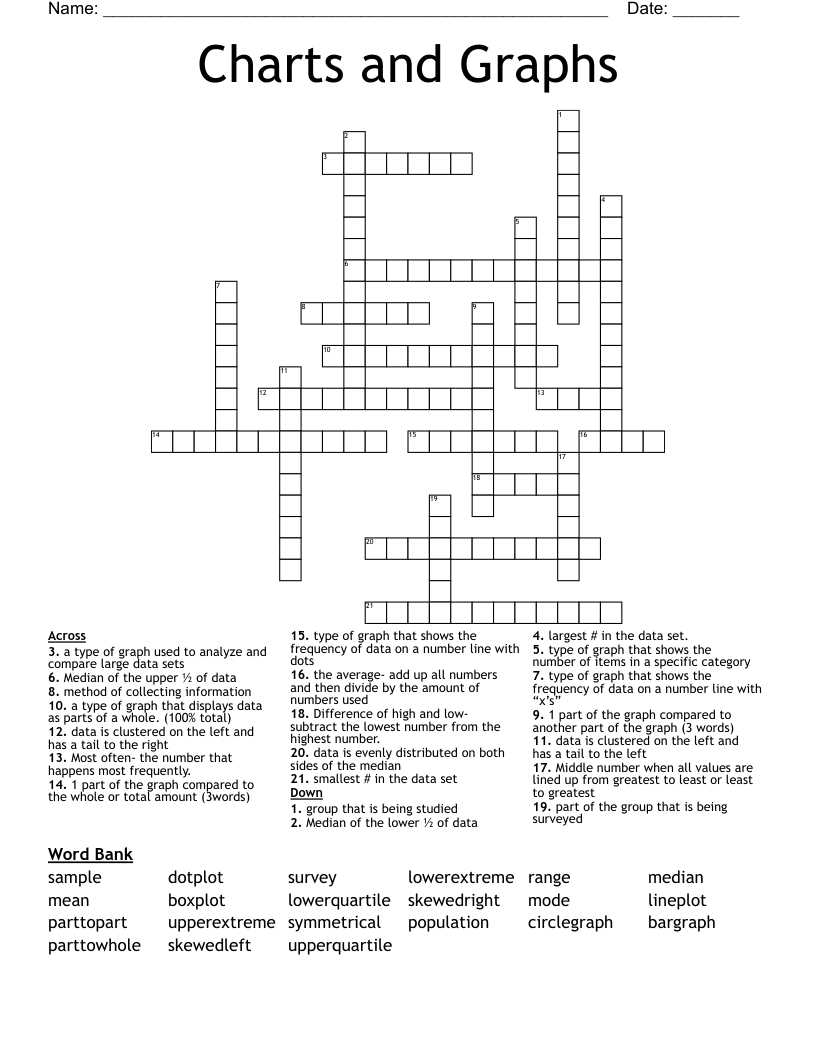
Charts and Graphs Crossword
This printable crossword puzzle on the topic of Statistics & Probability has 21 clues. Answers range from 4 to 13 letters long. This crossword is also available to download as a Microsoft Word document or a PDF.
Description
type of graph that shows the number of items in a specific category
type of graph that shows the frequency of data on a number line with dots
type of graph that shows the frequency of data on a number line with “x’s”
a type of graph that displays data as parts of a whole. (100% total)
method of collecting information
group that is being studied
part of the group that is being surveyed
a type of graph used to analyze and compare large data sets
1 part of the graph compared to the whole or total amount (3words)
1 part of the graph compared to another part of the graph (3 words)
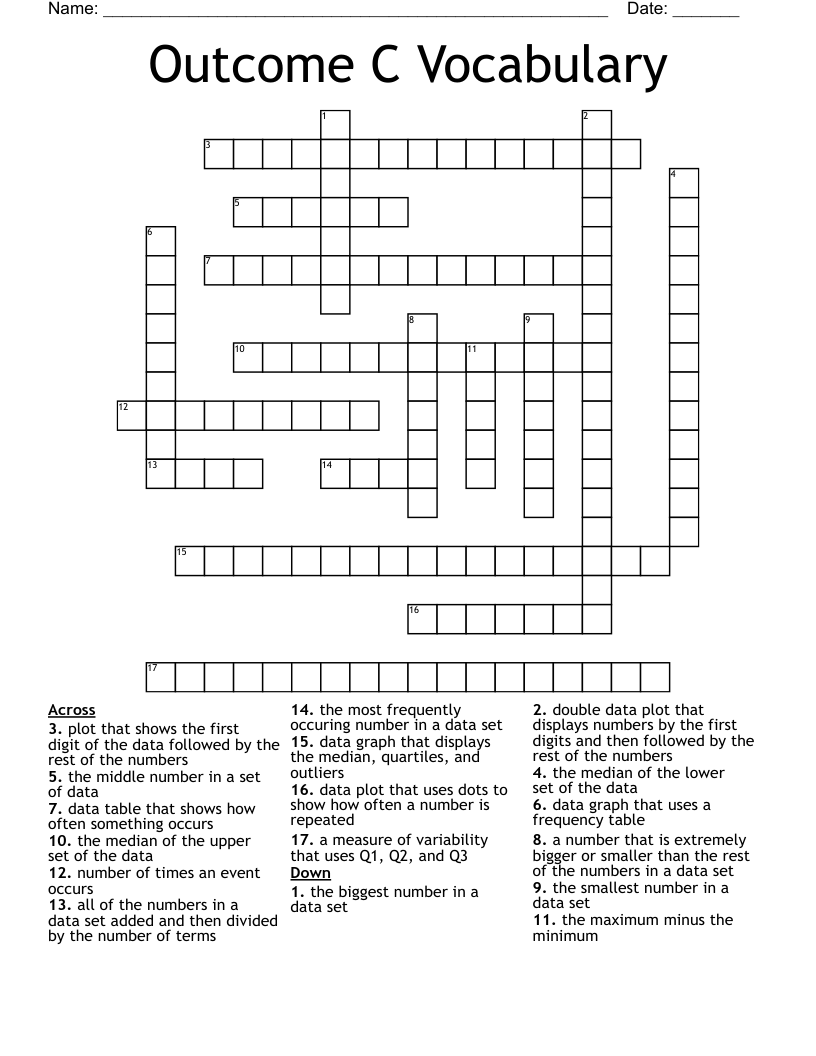
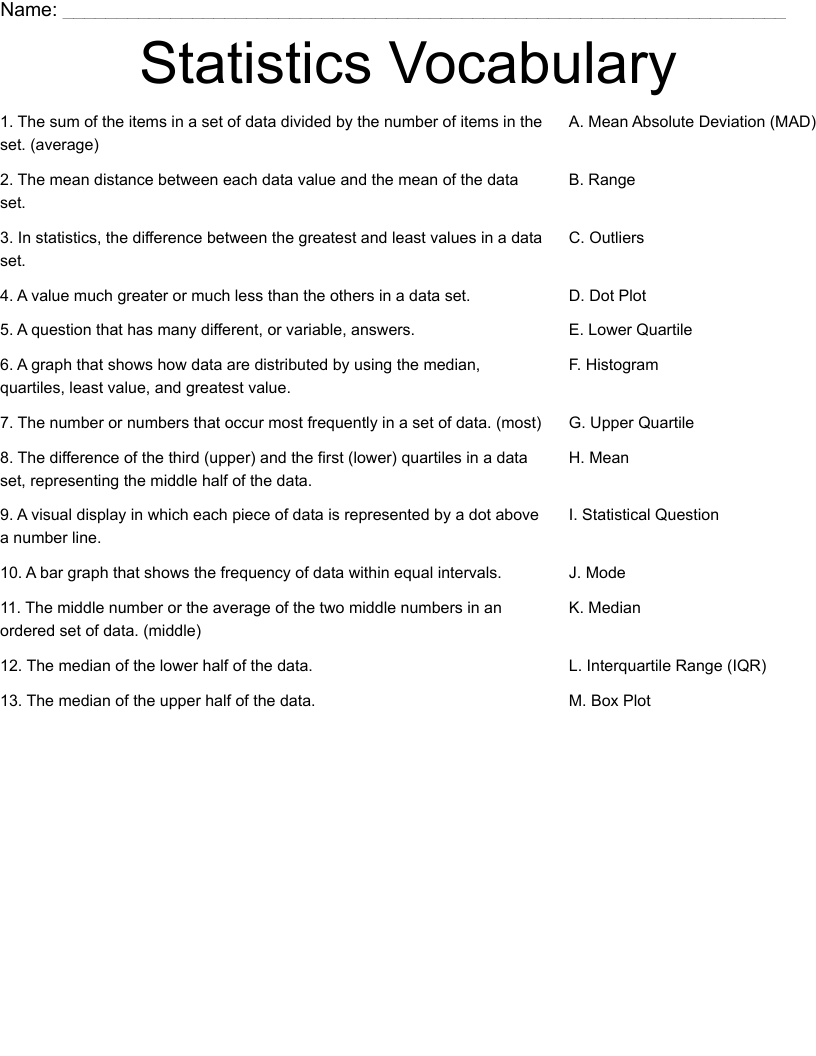
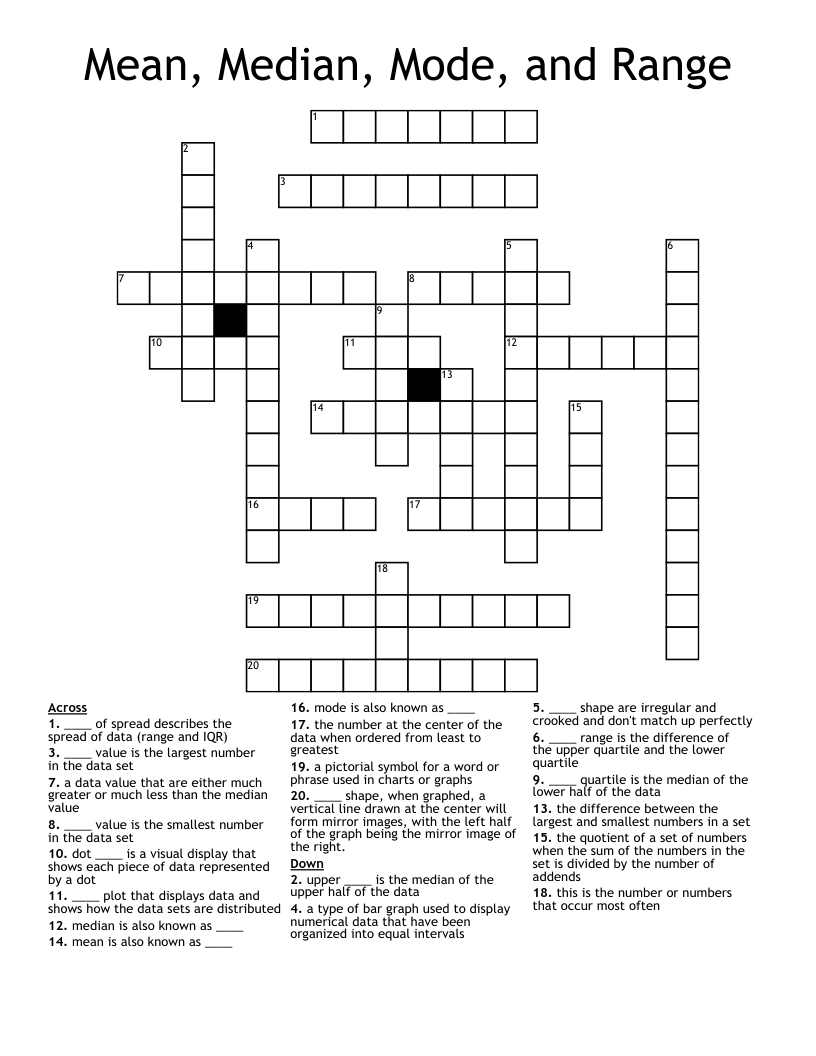
Middle number when all values are lined up from greatest to least or least to greatest
the average- add up all numbers and then divide by the amount of numbers used
Most often- the number that happens most frequently.
Difference of high and low- subtract the lowest number from the highest number.
smallest # in the data set
largest # in the data set.
Median of the lower ½ of data
Median of the upper ½ of data
data is evenly distributed on both sides of the median
data is clustered on the left and has a tail to the right
data is clustered on the left and has a tail to the left