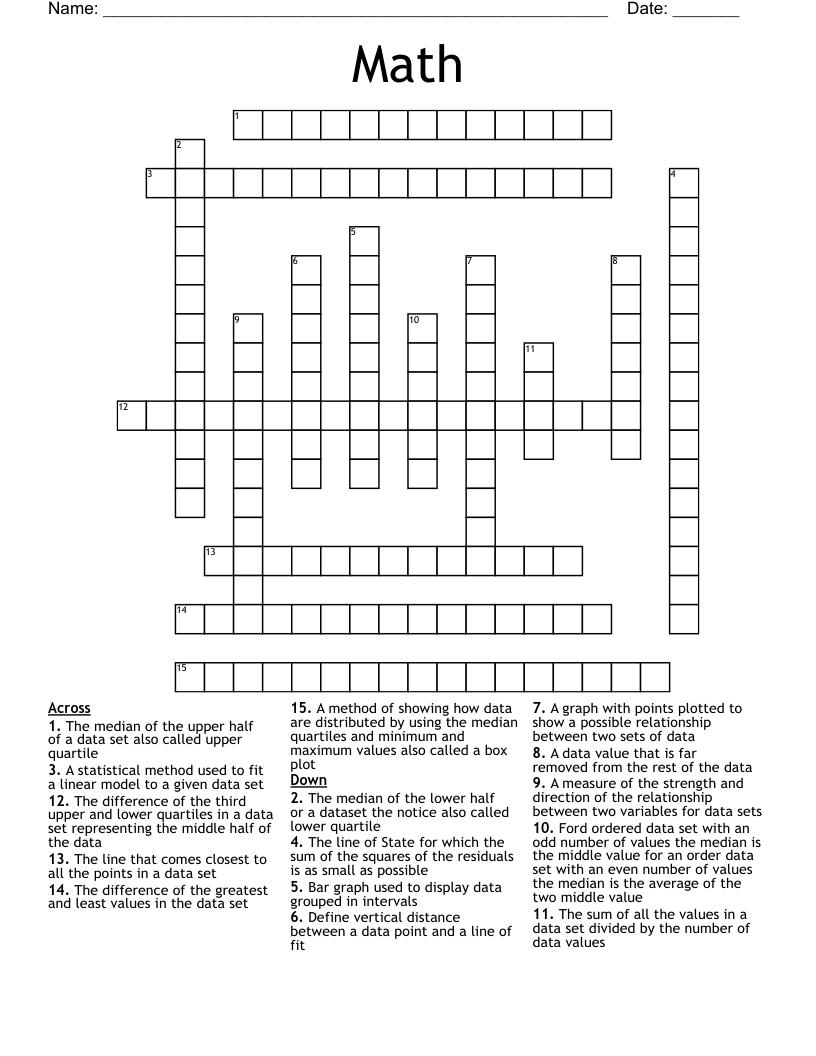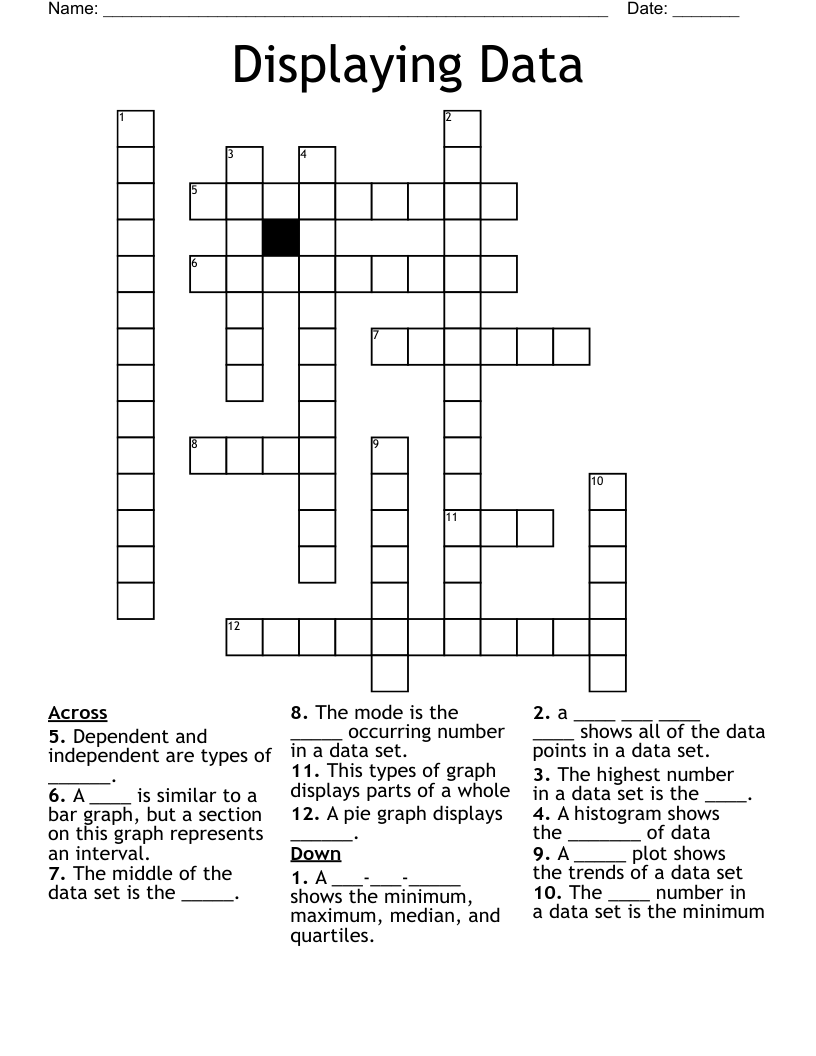
Displaying Data Crossword
This printable crossword puzzle on the topic of Statistics & Probability has 12 clues. Answers range from 3 to 15 letters long. This crossword is also available to download as a Microsoft Word document or a PDF.
Description
This types of graph displays parts of a whole
A pie graph displays ______.
The middle of the data set is the _____.
The mode is the _____ occurring number in a data set.
A ____ is similar to a bar graph, but a section on this graph represents an interval.
A ___-___-_____ shows the minimum, maximum, median, and quartiles.
Dependent and independent are types of ______.
The ____ number in a data set is the minimum
The highest number in a data set is the ____.
A _____ plot shows the trends of a data set
A histogram shows the _______ of data
a ____ ___ ____ ____ shows all of the data points in a data set.