Statistics Review Crossword
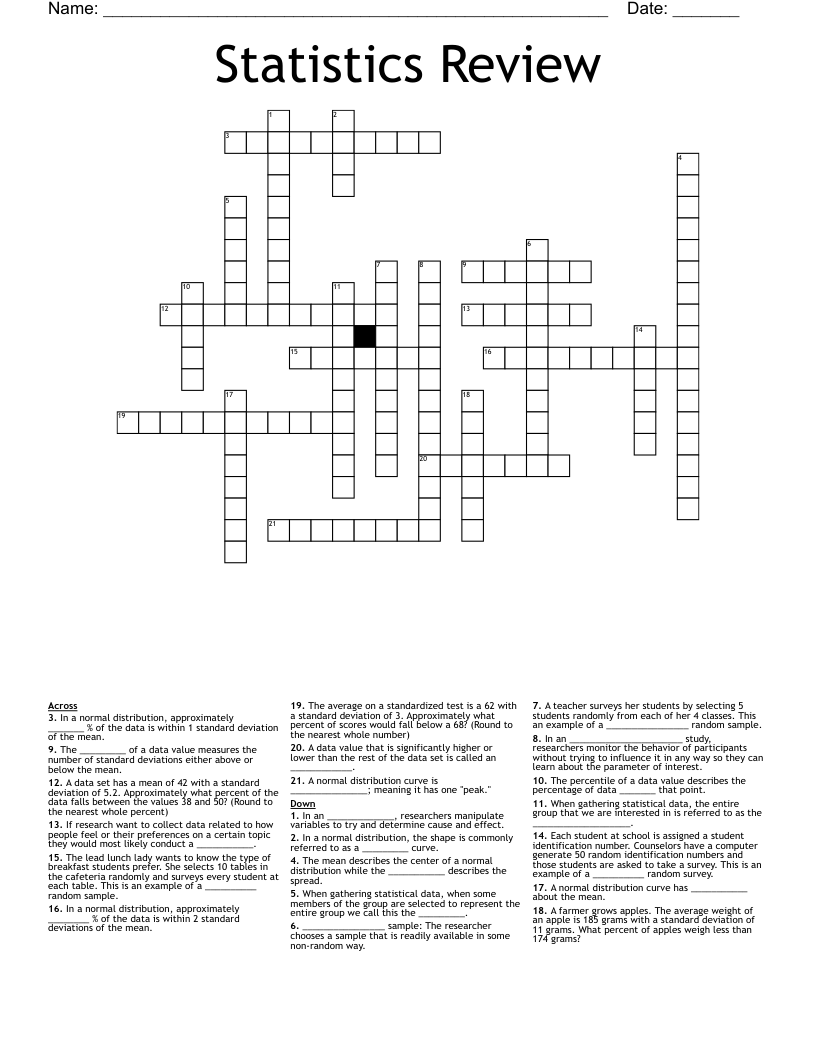
This printable crossword puzzle on the topic of Statistics & Probability has 21 clues. Answers range from 4 to 17 letters long. This crossword is also available to download as a Microsoft Word document or a PDF.
Description
In a normal distribution, the shape is commonly referred to as a _________ curve.
In a normal distribution, approximately _______ % of the data is within 1 standard deviation of the mean.
A normal distribution curve is _______________; meaning it has one "peak."
A normal distribution curve has ___________ about the mean.
The mean describes the center of a normal distribution while the ___________ describes the spread.
A data value that is significantly higher or lower than the rest of the data set is called an ____________.
The percentile of a data value describes the percentage of data _______ that point.
________________ sample: The researcher chooses a sample that is readily available in some non-random way.
A teacher surveys her students by selecting 5 students randomly from each of her 4 classes. This an example of a ________________ random sample.
The lead lunch lady wants to know the type of breakfast students prefer. She selects 10 tables in the cafeteria randomly and surveys every student at each table. This is an example of a __________ random sample.
Each student at school is assigned a student identification number. Counselors have a computer generate 50 random identification numbers and those students are asked to take a survey. This is an example of a __________ random survey.
A farmer grows apples. The average weight of an apple is 185 grams with a standard deviation of 11 grams. What percent of apples weigh less than 174 grams?
The _________ of a data value measures the number of standard deviations either above or below the mean.
When gathering statistical data, the entire group that we are interested in is referred to as the ___________________.
When gathering statistical data, when some members of the group are selected to represent the entire group we call this the _________.
The average on a standardized test is a 62 with a standard deviation of 3. Approximately what percent of scores would fall below a 68? (Round to the nearest whole number)
A data set has a mean of 42 with a standard deviation of 5.2. Approximately what percent of the data falls between the values 38 and 50? (Round to the nearest whole percent)
In a normal distribution, approximately ________ % of the data is within 2 standard deviations of the mean.
If research want to collect data related to how people feel or their preferences on a certain topic they would most likely conduct a ___________.
In an ______________________ study, researchers monitor the behavior of participants without trying to influence it in any way so they can learn about the parameter of interest.
In an _____________, researchers manipulate variables to try and determine cause and effect.