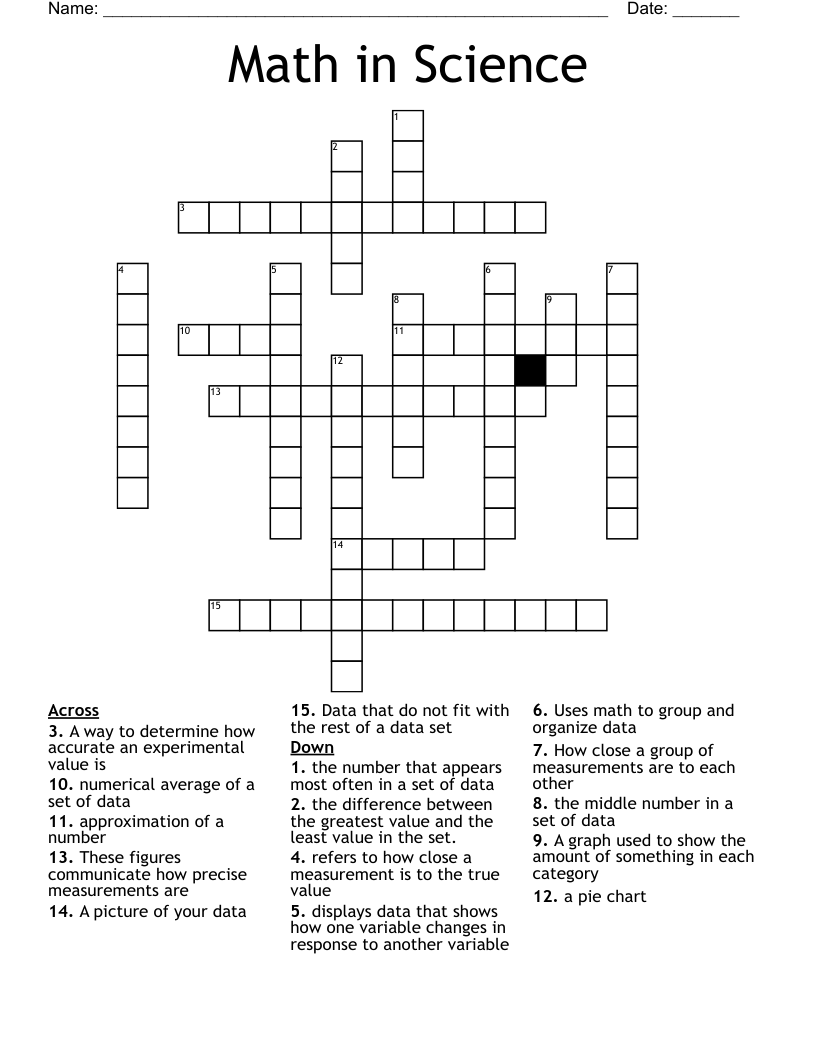
Math in Science Crossword
This printable crossword puzzle on the topic of Statistics & Probability has 15 clues. Answers range from 3 to 13 letters long. This crossword is also available to download as a Microsoft Word document or a PDF.
Description
Uses math to group and organize data
approximation of a number
refers to how close a measurement is to the true value
A way to determine how accurate an experimental value is
numerical average of a set of data
the middle number in a set of data
the number that appears most often in a set of data
the difference between the greatest value and the least value in the set.
Data that do not fit with the rest of a data set
These figures communicate how precise measurements are
How close a group of measurements are to each other
A picture of your data
A graph used to show the amount of something in each category
a pie chart
displays data that shows how one variable changes in response to another variable