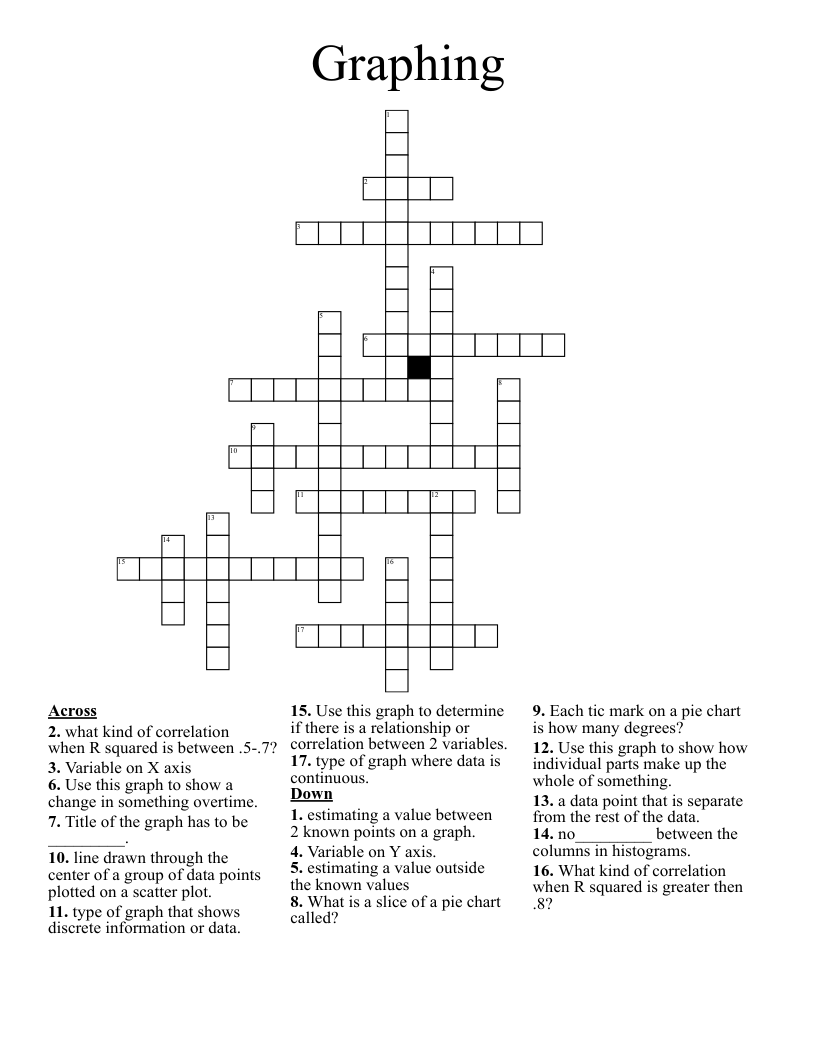
Graphing Crossword
This printable crossword puzzle on the topic of Statistics & Probability has 17 clues. Answers range from 4 to 13 letters long. This crossword is also available to download as a Microsoft Word document or a PDF.
Description
Use this graph to show a change in something overtime.
Use this graph to determine if there is a relationship or correlation between 2 variables.
line drawn through the center of a group of data points plotted on a scatter plot.
Use this graph to show how individual parts make up the whole of something.
What is a slice of a pie chart called?
type of graph that shows discrete information or data.
type of graph where data is continuous.
no_________ between the columns in histograms.
Variable on Y axis.
Variable on X axis
What kind of correlation when R squared is greater then .8?
what kind of correlation when R squared is between .5-.7?
Each tic mark on a pie chart is how many degrees?
estimating a value between 2 known points on a graph.
estimating a value outside the known values
a data point that is separate from the rest of the data.
Title of the graph has to be _________.