Data Managment Vocabulary Crossword
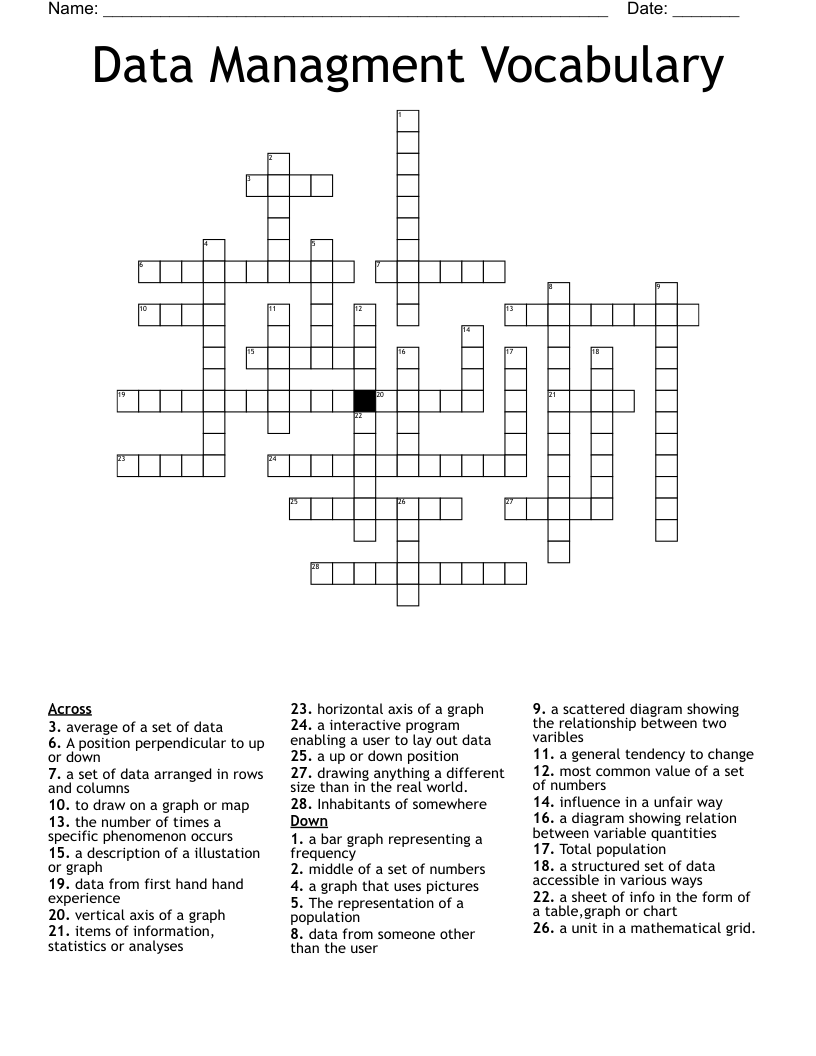
This printable crossword puzzle on the topic of Statistics & Probability has 28 clues. Answers range from 4 to 13 letters long. This crossword is also available to download as a Microsoft Word document or a PDF.
Description
The representation of a population
Total population
Inhabitants of somewhere
a structured set of data accessible in various ways
a sheet of info in the form of a table,graph or chart
a set of data arranged in rows and columns
a interactive program enabling a user to lay out data
horizontal axis of a graph
a general tendency to change
A position perpendicular to up or down
a up or down position
a description of a illustation or graph
a graph that uses pictures
a bar graph representing a frequency
a scattered diagram showing the relationship between two varibles
average of a set of data
middle of a set of numbers
most common value of a set of numbers
the number of times a specific phenomenon occurs
data from first hand hand experience
data from someone other than the user
items of information, statistics or analyses
influence in a unfair way
a diagram showing relation between variable quantities
vertical axis of a graph
to draw on a graph or map
drawing anything a different size than in the real world.
a unit in a mathematical grid.