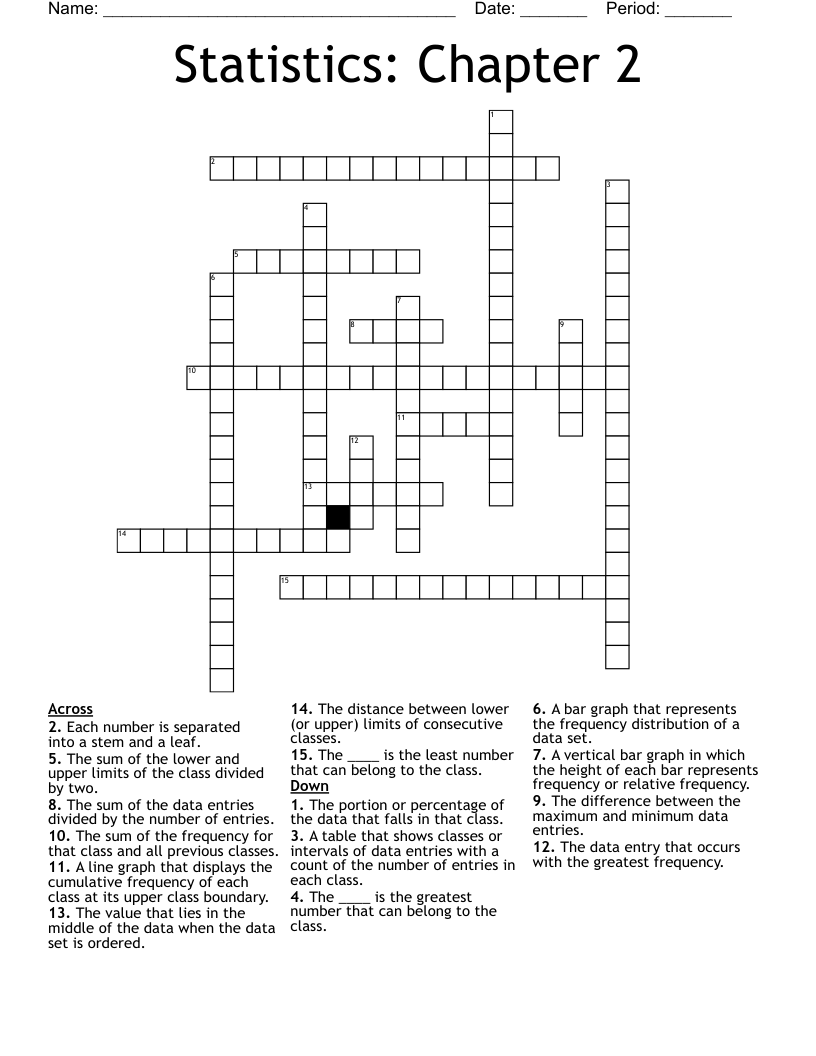
Statistics: Chapter 2 Crossword
This printable crossword puzzle on the topic of Statistics & Probability has 15 clues. Answers range from 4 to 21 letters long. This crossword is also available to download as a Microsoft Word document or a PDF.
Description
A table that shows classes or intervals of data entries with a count of the number of entries in each class.
The ____ is the least number that can belong to the class.
The ____ is the greatest number that can belong to the class.
The distance between lower (or upper) limits of consecutive classes.
The difference between the maximum and minimum data entries.
The sum of the lower and upper limits of the class divided by two.
The portion or percentage of the data that falls in that class.
The sum of the frequency for that class and all previous classes.
A bar graph that represents the frequency distribution of a data set.
A line graph that displays the cumulative frequency of each class at its upper class boundary.
Each number is separated into a stem and a leaf.
A vertical bar graph in which the height of each bar represents frequency or relative frequency.
The sum of the data entries divided by the number of entries.
The value that lies in the middle of the data when the data set is ordered.
The data entry that occurs with the greatest frequency.