Chapter 2 Statistics Vocab Crossword
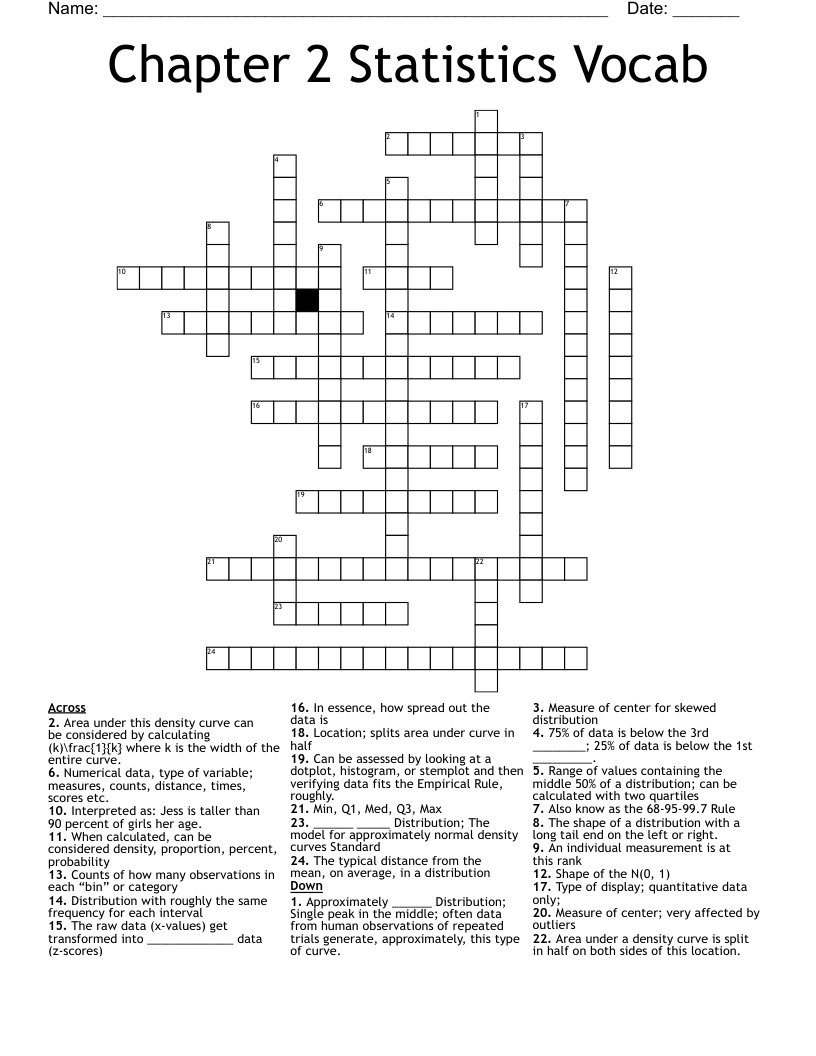
This printable crossword puzzle on the topic of Statistics & Probability has 24 clues. Answers range from 4 to 18 letters long. This crossword is also available to download as a Microsoft Word document or a PDF.
Description
An individual measurement is at this rank
Interpreted as: Jess is taller than 90 percent of girls her age.
The raw data (x-values) get transformed into _____________ data (z-scores)
Location; splits area under curve in half
Approximately ______ Distribution; Single peak in the middle; often data from human observations of repeated trials generate, approximately, this type of curve.
Also know as the 68-95-99.7 Rule
______ _____ Distribution; The model for approximately normal density curves Standard
Measure of center for skewed distribution
Shape of the N(0, 1)
Counts of how many observations in each “bin” or category
Measure of center; very affected by outliers
Range of values containing the middle 50% of a distribution; can be calculated with two quartiles
Numerical data, type of variable; measures, counts, distance, times, scores etc.
Type of display; quantitative data only;
In essence, how spread out the data is
The typical distance from the mean, on average, in a distribution
When calculated, can be considered density, proportion, percent, probability
Min, Q1, Med, Q3, Max
Can be assessed by looking at a dotplot, histogram, or stemplot and then verifying data fits the Empirical Rule, roughly.
Distribution with roughly the same frequency for each interval
The shape of a distribution with a long tail end on the left or right.
Area under this density curve can be considered by calculating (k)\frac{1}{k} where k is the width of the entire curve.
Area under a density curve is split in half on both sides of this location.
75% of data is below the 3rd ________; 25% of data is below the 1st _________.