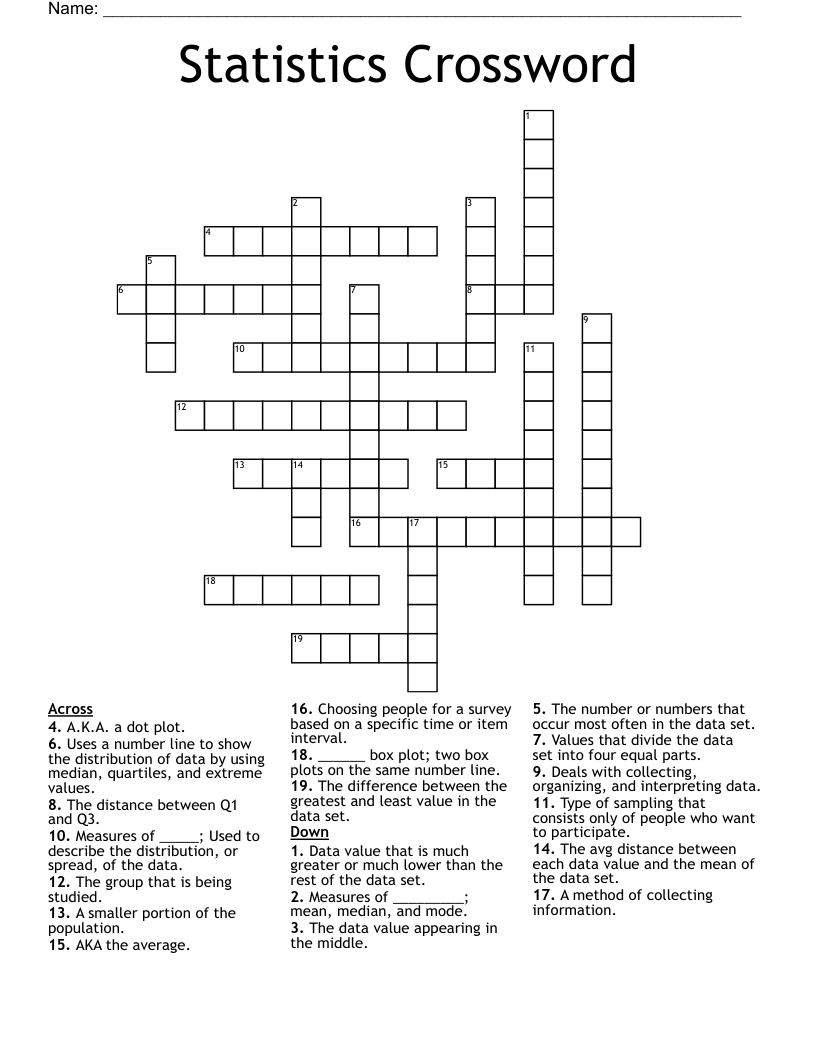
Statistics Crossword
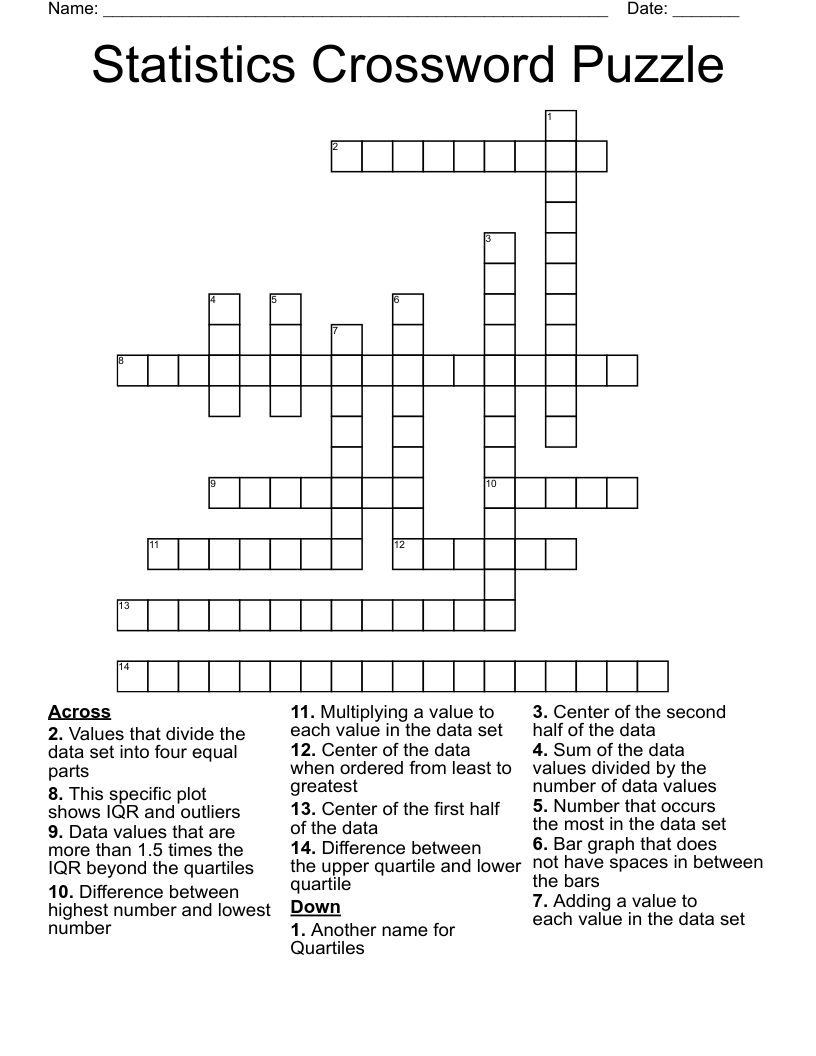
This printable crossword puzzle on the topic of Statistics & Probability has 19 clues. Answers range from 3 to 10 letters long. This crossword is also available to download as a Microsoft Word document or a PDF.
Description
Uses a number line to show the distribution of data by using median, quartiles, and extreme values.
Measures of _________; mean, median, and mode.
______ box plot; two box plots on the same number line.
The distance between Q1 and Q3.
A.K.A. a dot plot.
The avg distance between each data value and the mean of the data set.
AKA the average.
The data value appearing in the middle.
The number or numbers that occur most often in the data set.
Data value that is much greater or much lower than the rest of the data set.
The group that is being studied.
Values that divide the data set into four equal parts.
The difference between the greatest and least value in the data set.
A smaller portion of the population.
Deals with collecting, organizing, and interpreting data.
A method of collecting information.
Choosing people for a survey based on a specific time or item interval.
Measures of _____; Used to describe the distribution, or spread, of the data.
Type of sampling that consists only of people who want to participate.