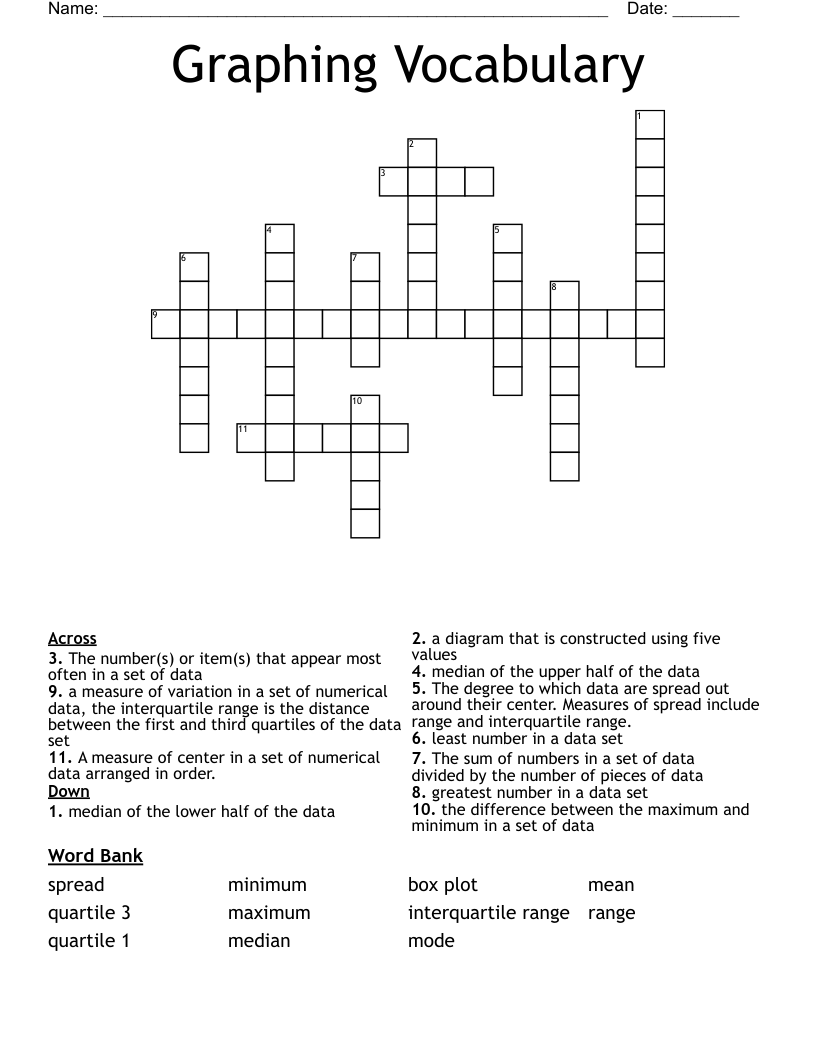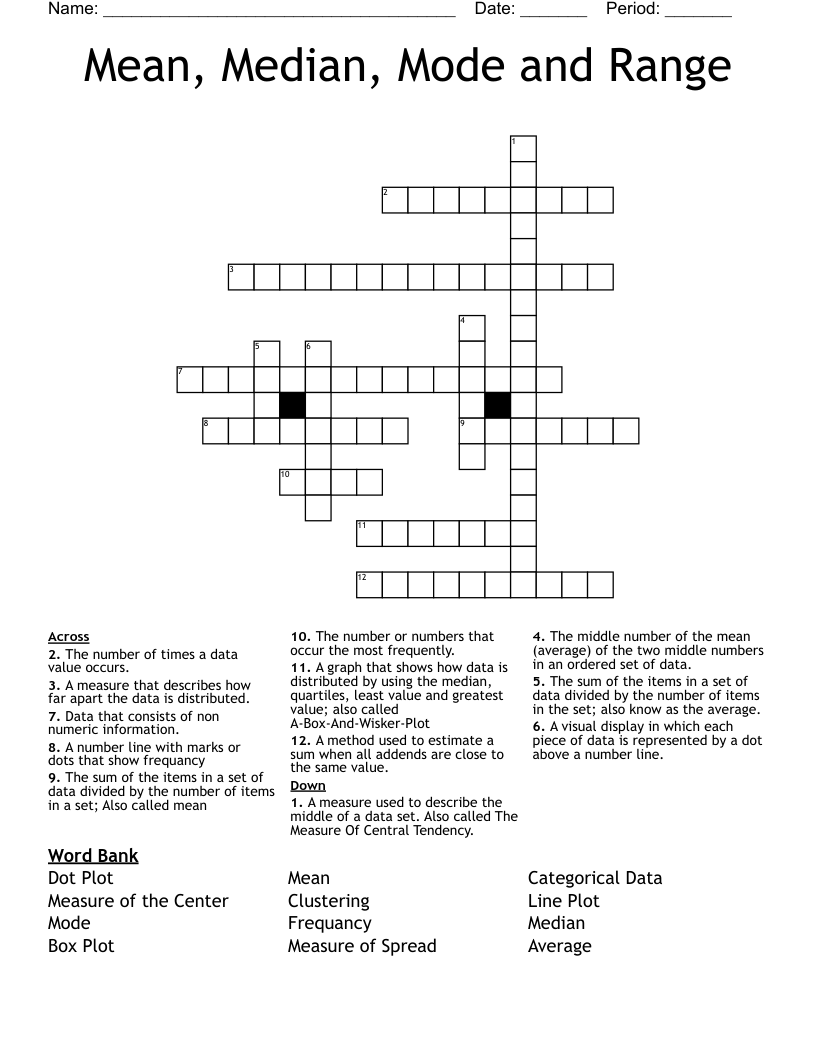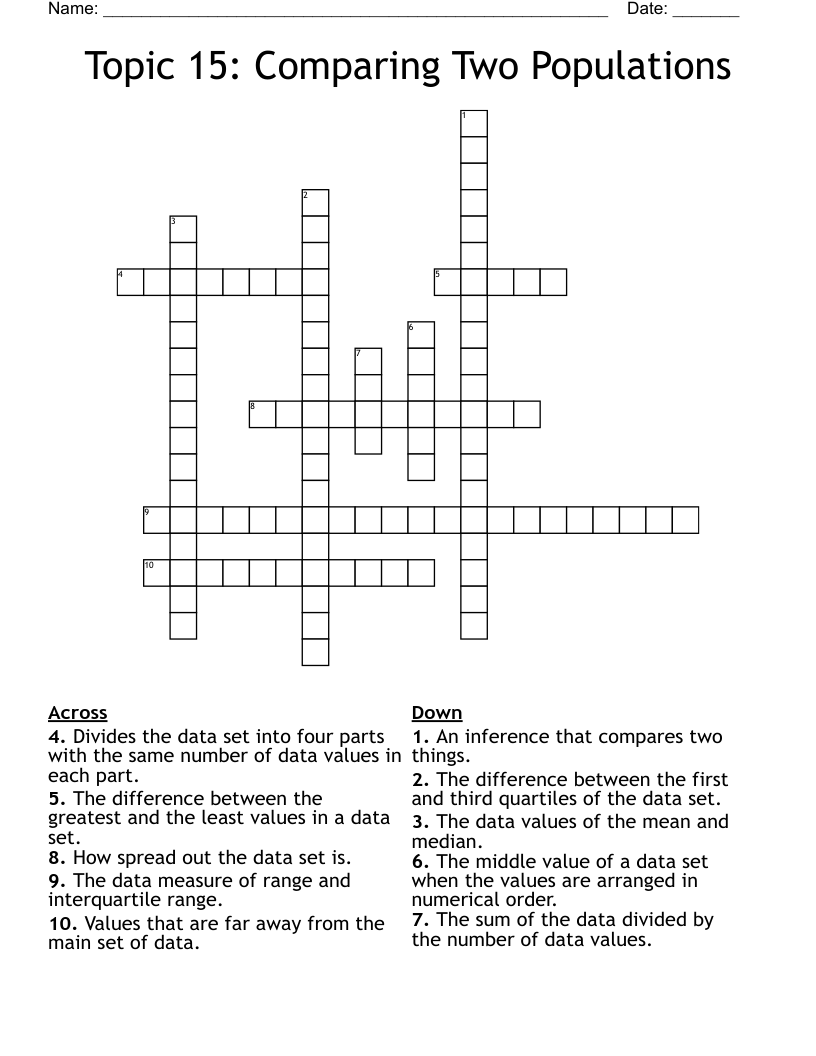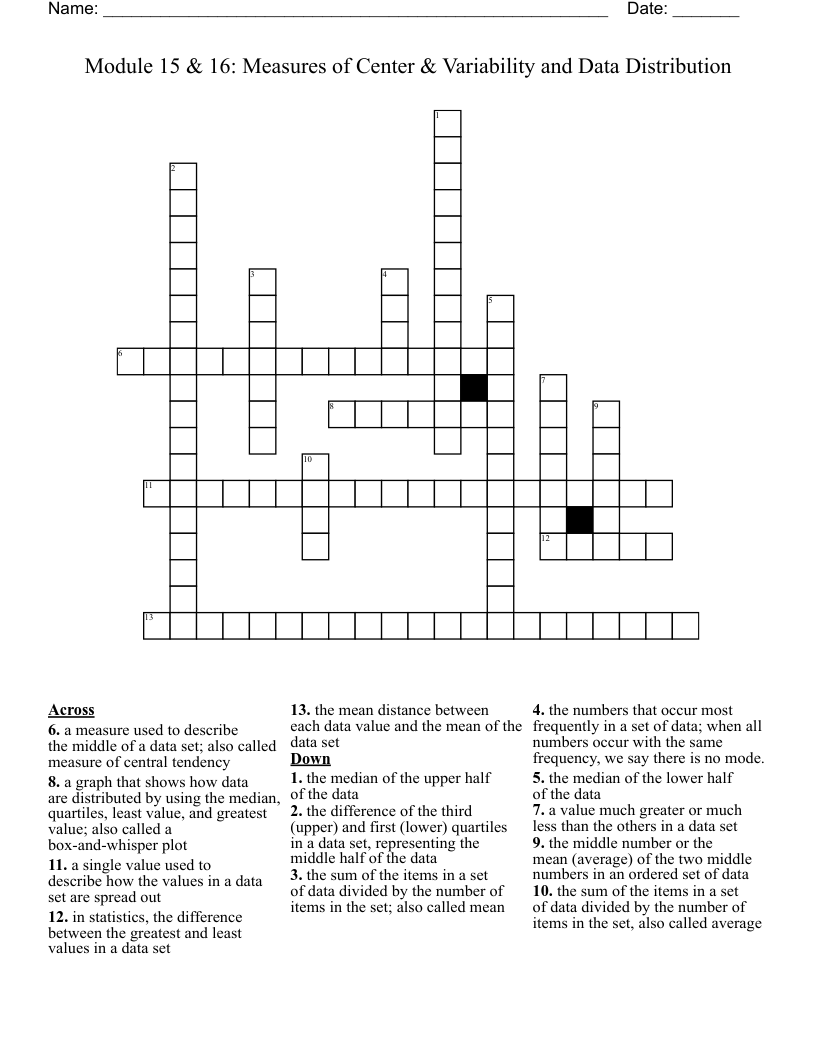
Module 15 & 16: Measures of Center & Variability and Data Distribution Crossword
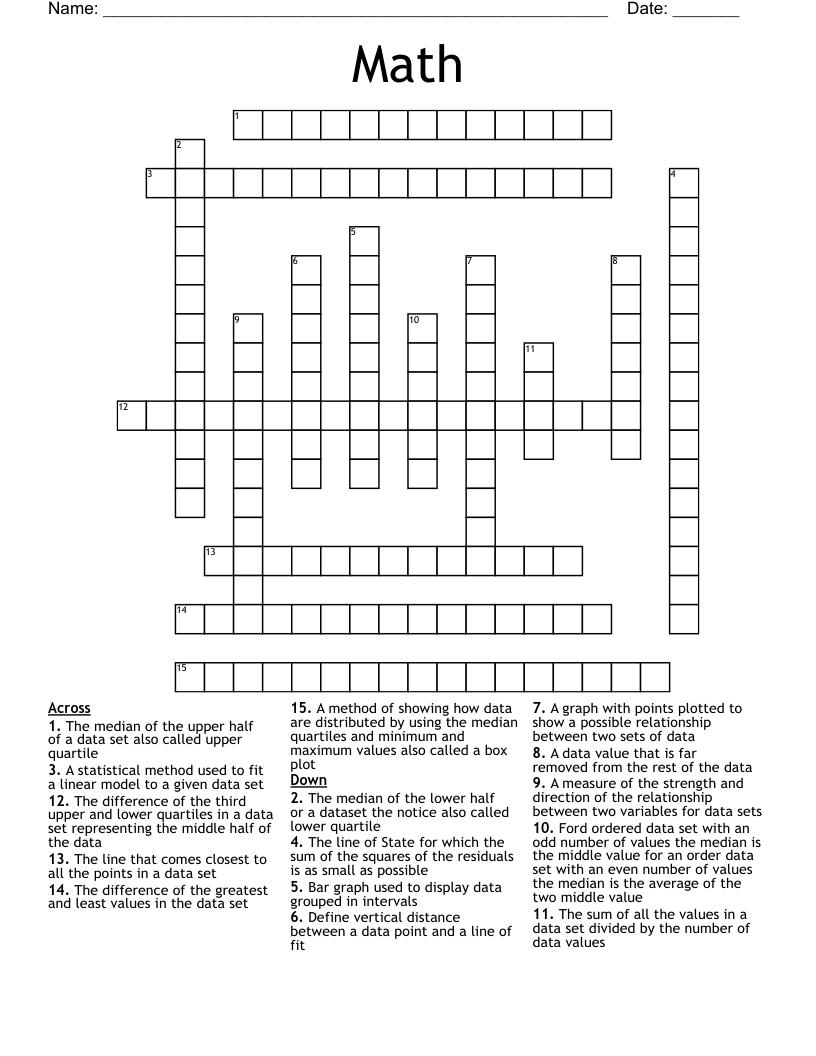
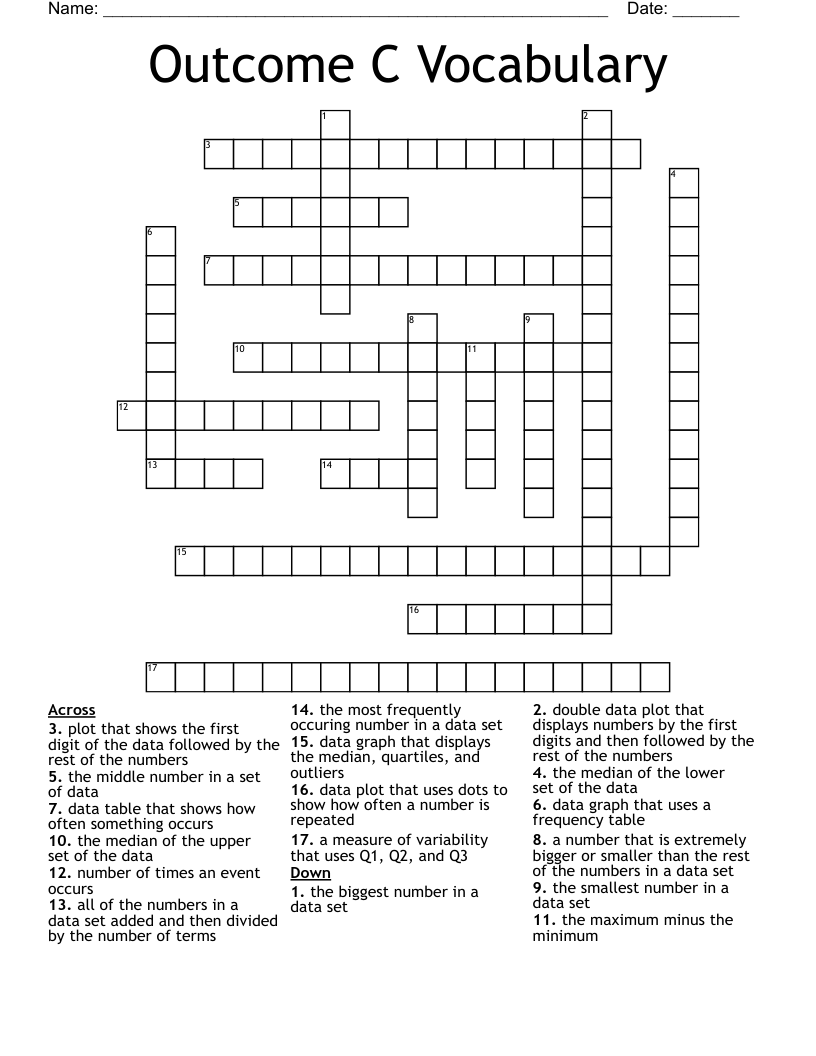
This printable crossword puzzle on the topic of Statistics & Probability has 13 clues. Answers range from 4 to 21 letters long. This crossword is also available to download as a Microsoft Word document or a PDF.
Description
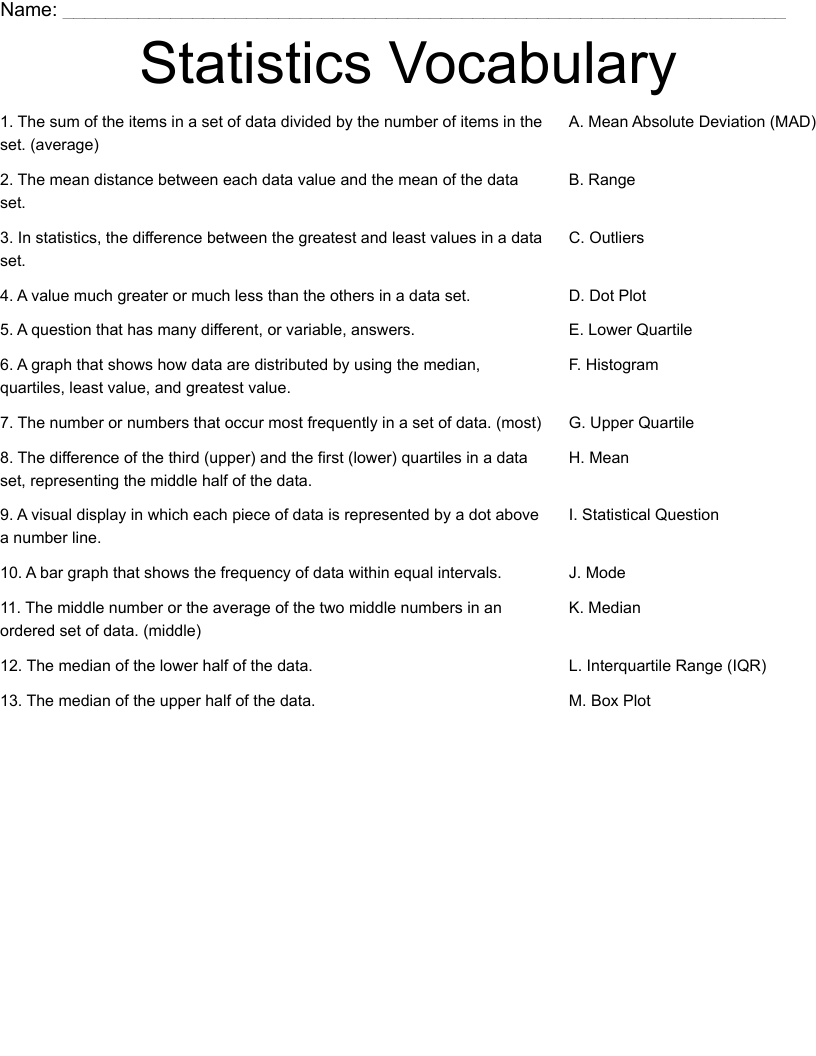
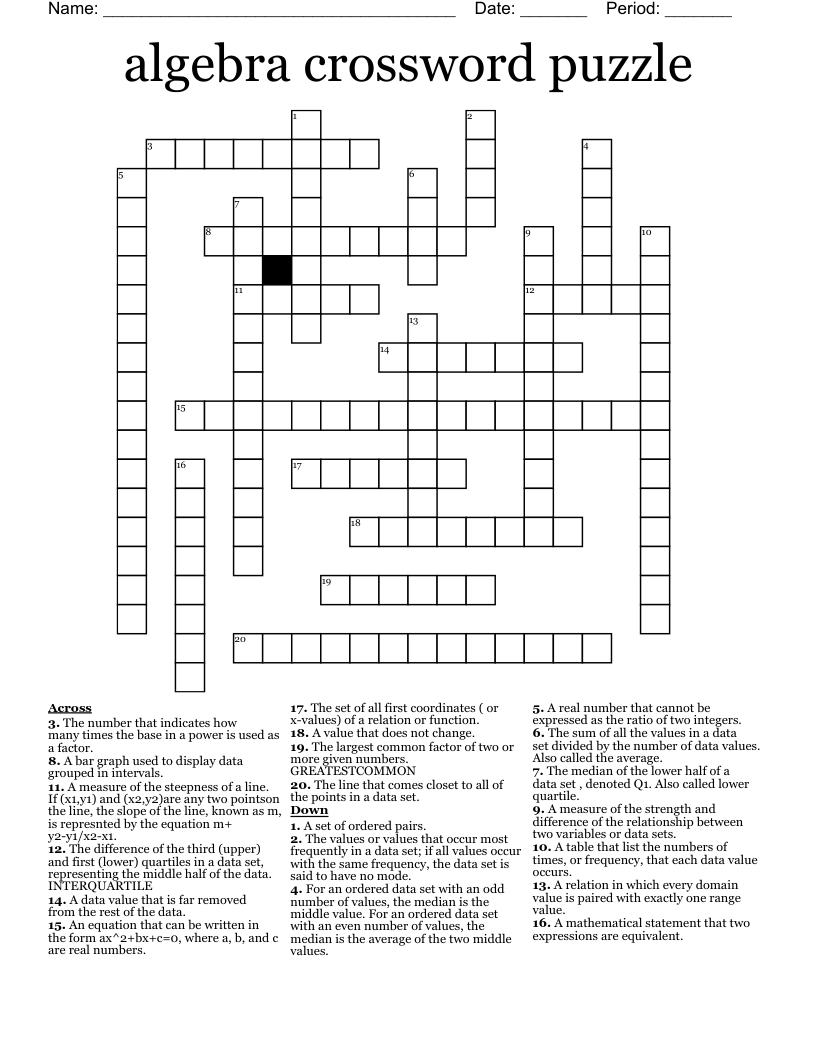
the sum of the items in a set of data divided by the number of items in the set; also called mean
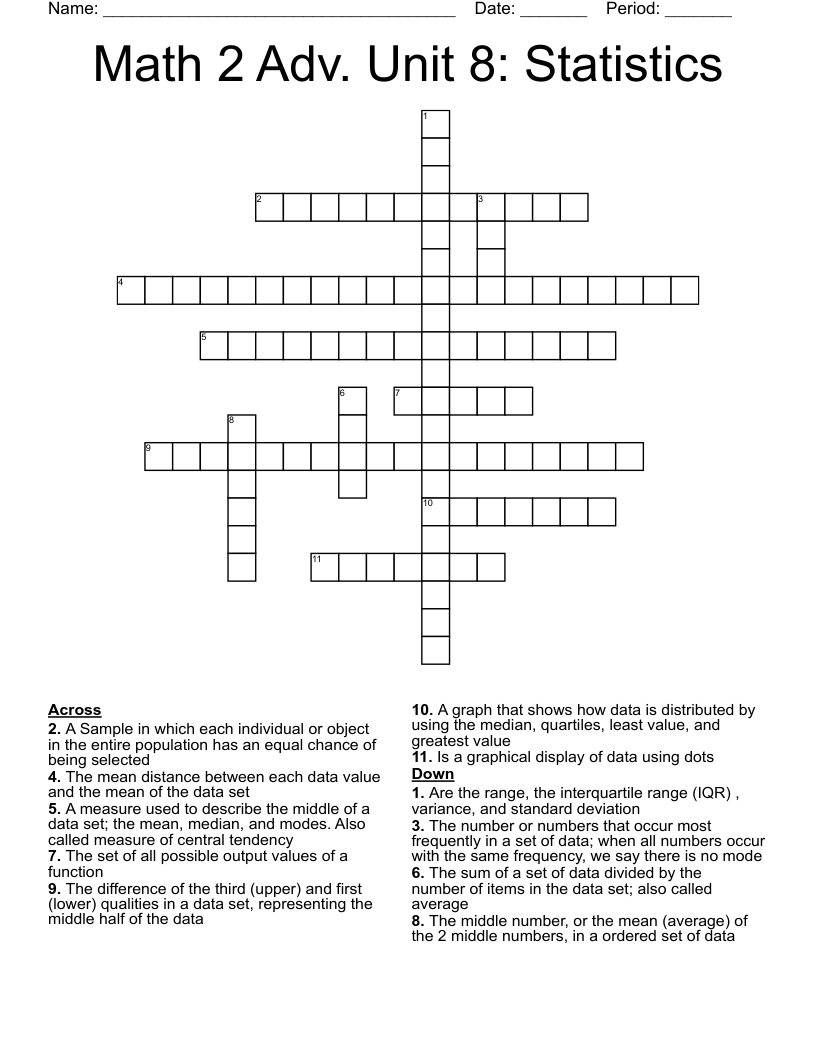
the sum of the items in a set of data divided by the number of items in the set, also called average
a measure used to describe the middle of a data set; also called measure of central tendency
the middle number or the mean (average) of the two middle numbers in an ordered set of data
the numbers that occur most frequently in a set of data; when all numbers occur with the same frequency, we say there is no mode.
a value much greater or much less than the others in a data set
a graph that shows how data are distributed by using the median, quartiles, least value, and greatest value; also called a box-and-whisper plot
the difference of the third (upper) and first (lower) quartiles in a data set, representing the middle half of the data
the median of the lower half of the data
the mean distance between each data value and the mean of the data set
in statistics, the difference between the greatest and least values in a data set
the median of the upper half of the data
a single value used to describe how the values in a data set are spread out