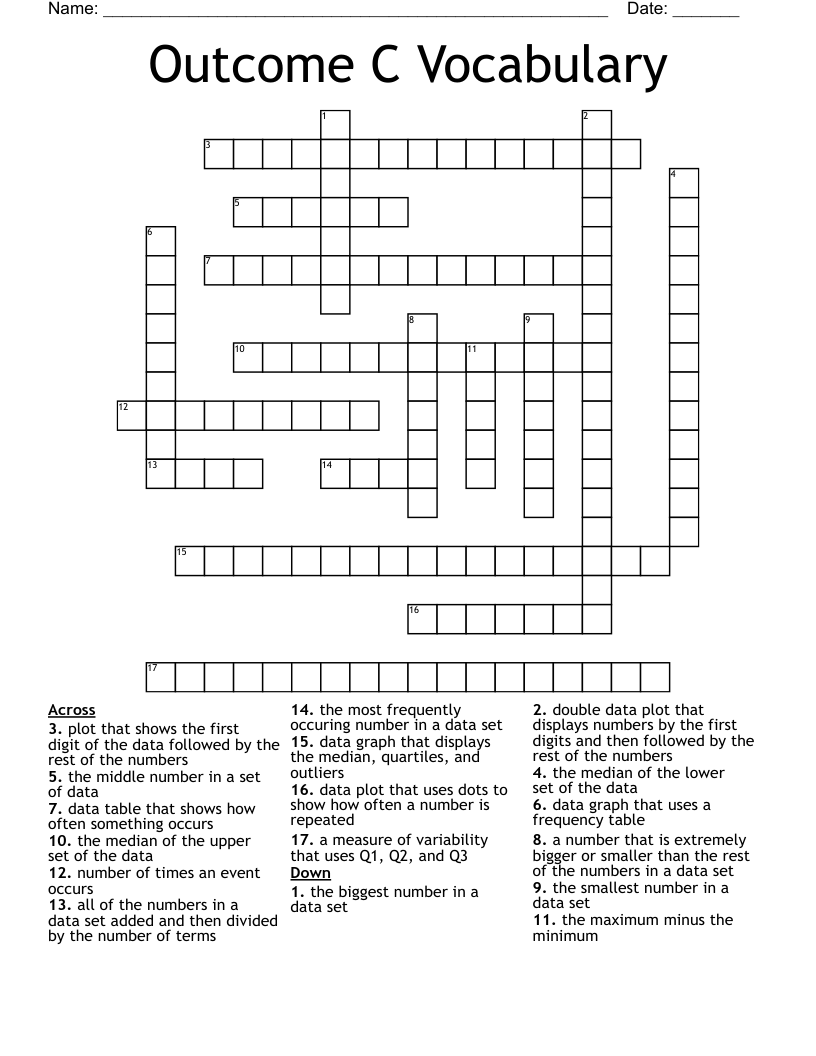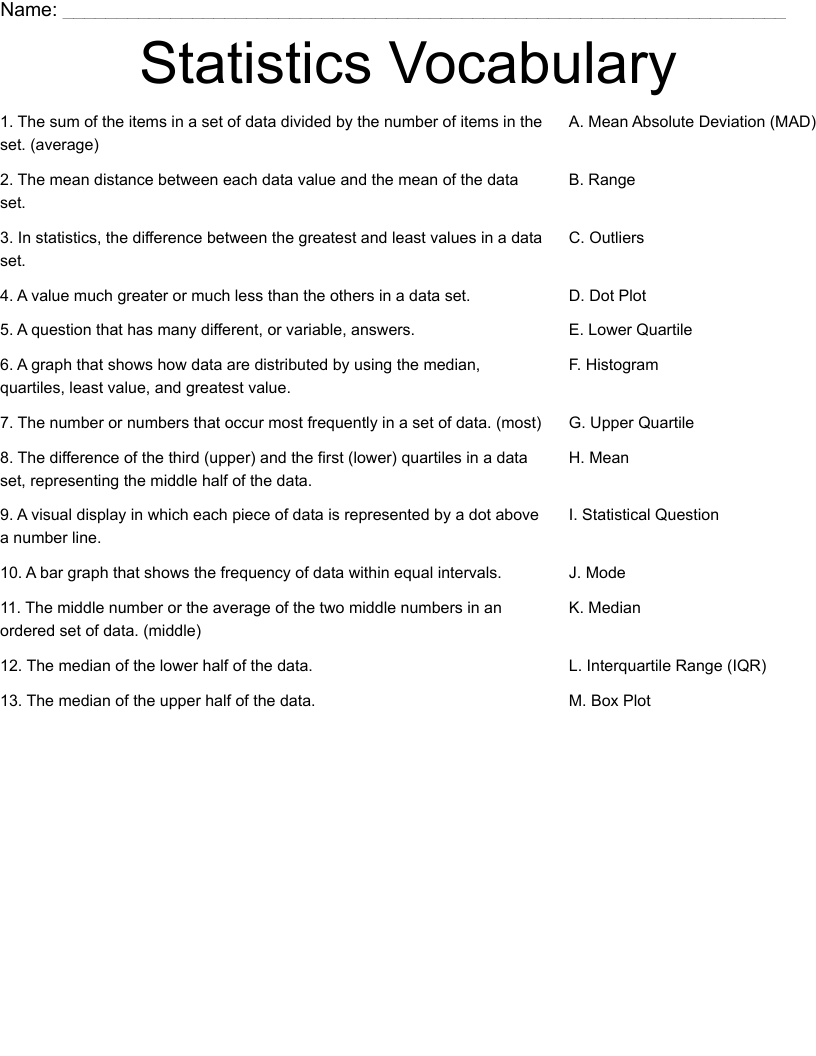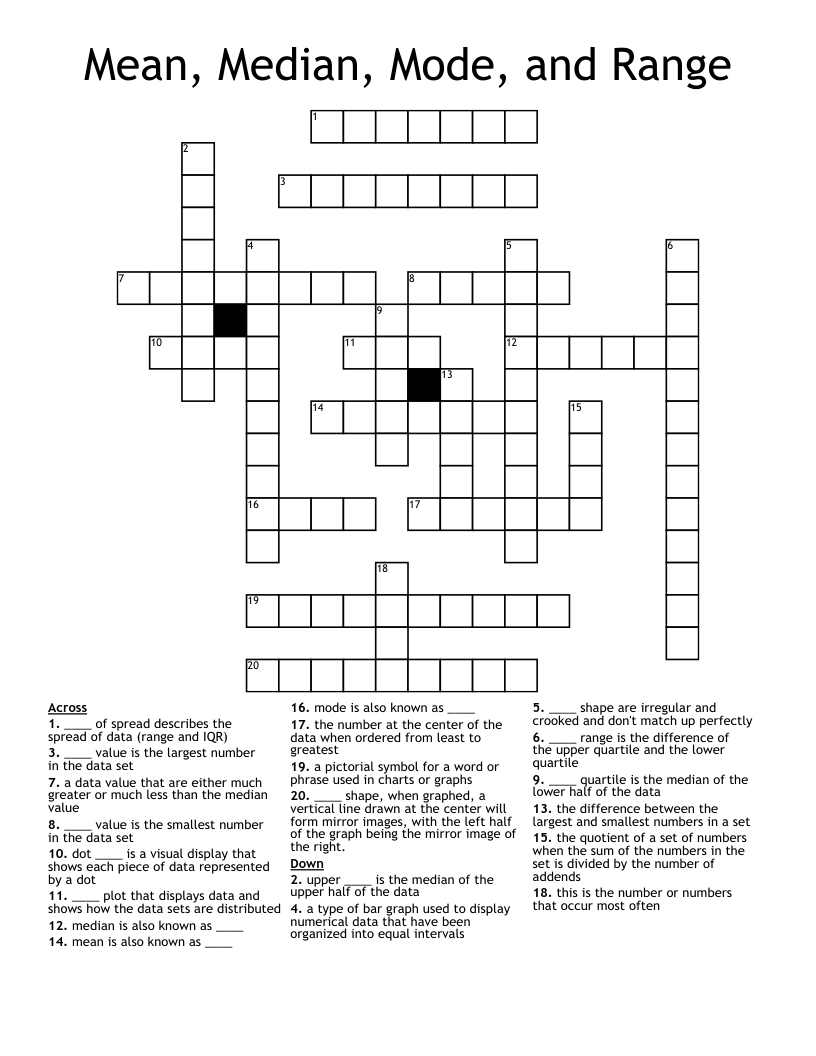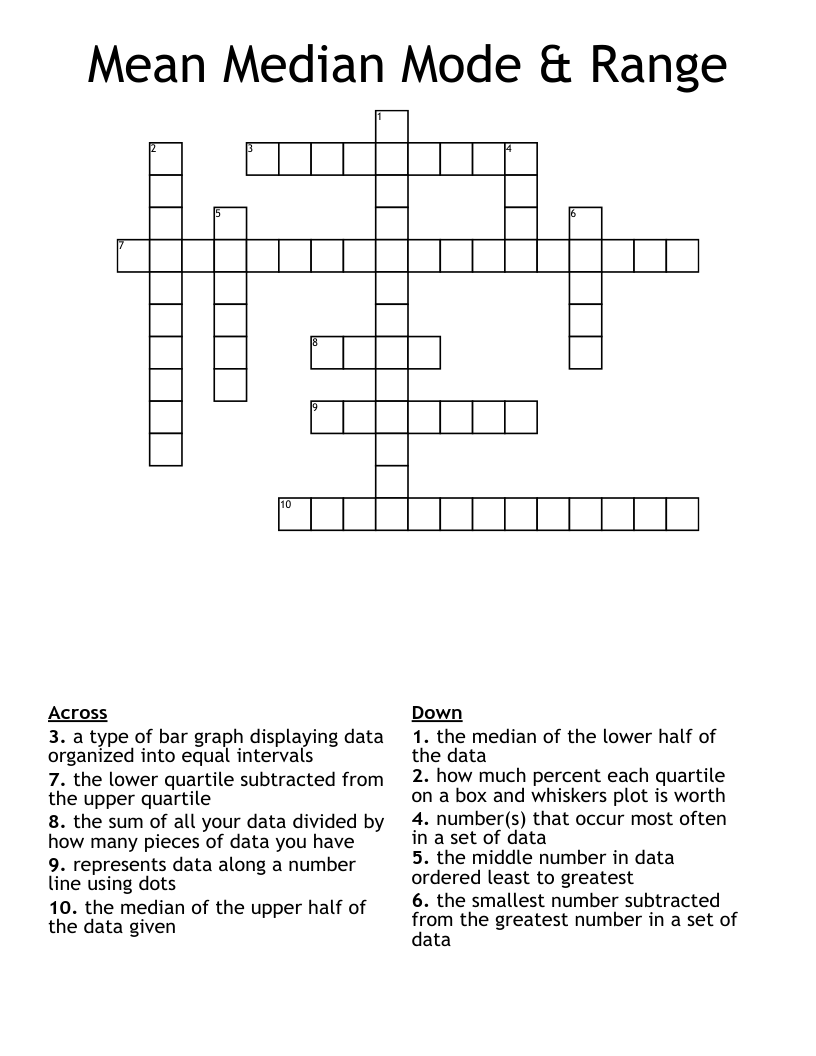
Statistics Worksheet
This printable matching worksheet on the topic of Statistics & Probability has 14 questions and answers to match. This matching worksheet is also available to download as a Microsoft Word document or a PDF.
Description
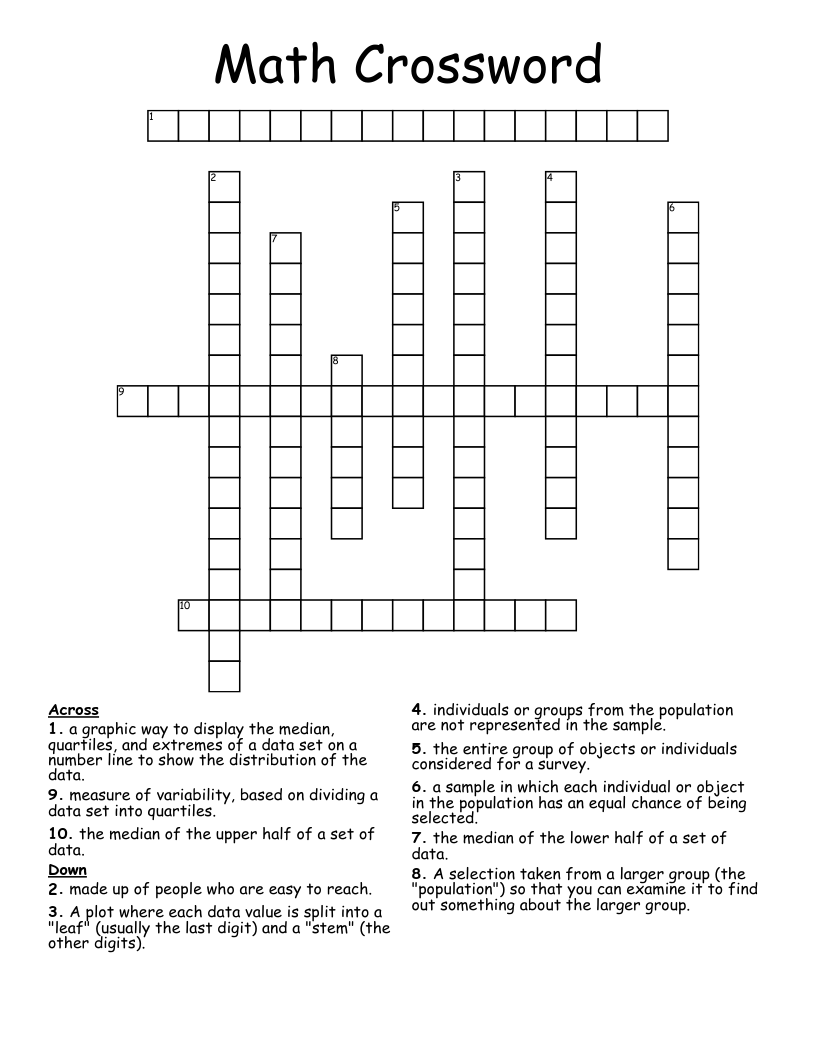
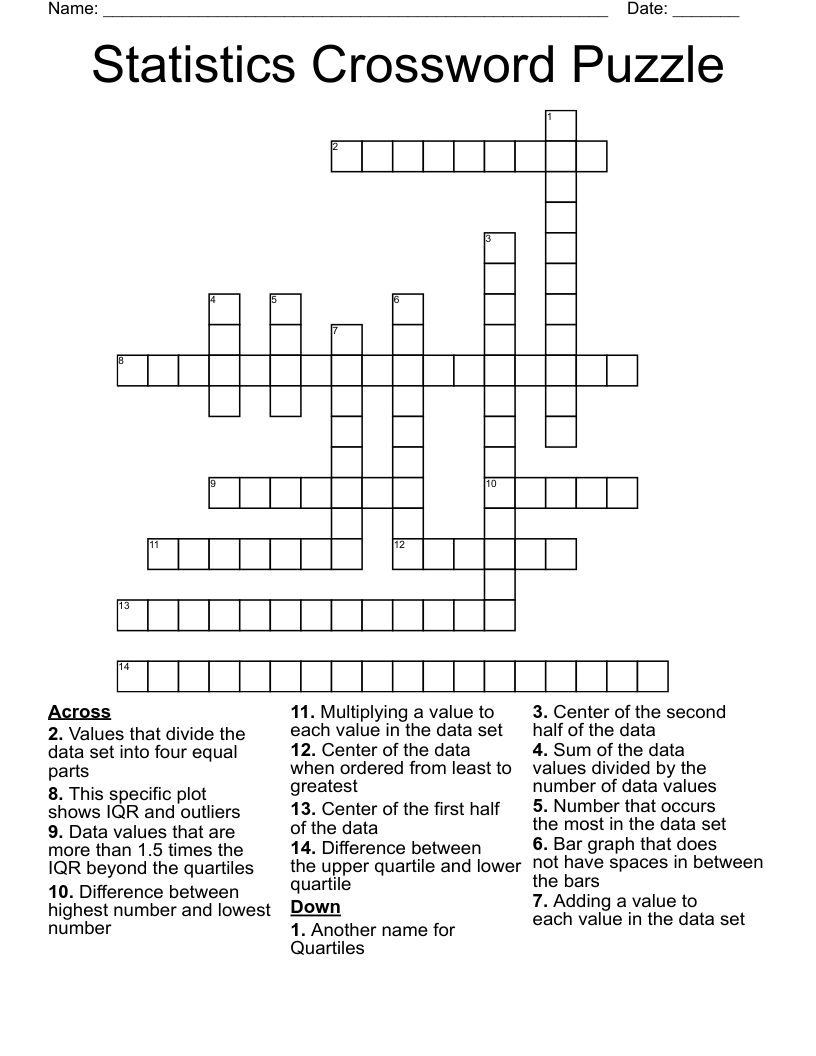
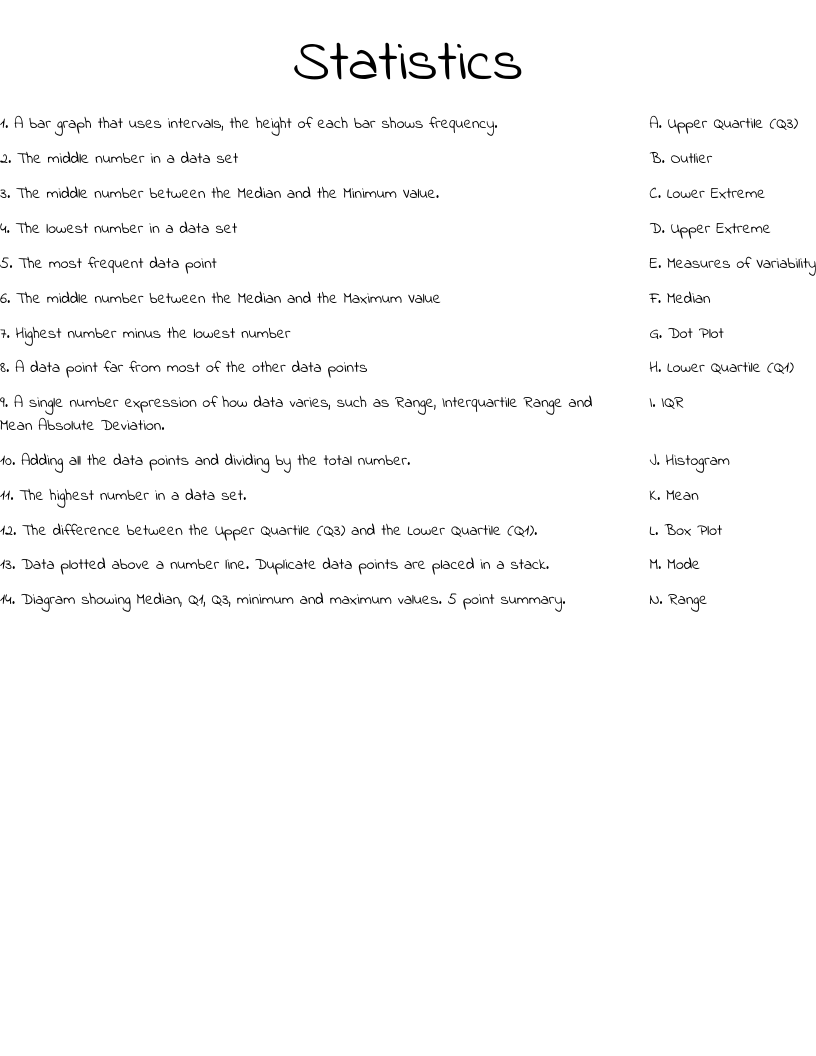
A bar graph that uses intervals, the height of each bar shows frequency.
The middle number in a data set
The middle number between the Median and the Minimum Value.
The lowest number in a data set
The most frequent data point
The middle number between the Median and the Maximum Value
Highest number minus the lowest number
A data point far from most of the other data points
A single number expression of how data varies, such as Range, Interquartile Range and Mean Absolute Deviation.
Adding all the data points and dividing by the total number.
The highest number in a data set.
The difference between the Upper Quartile (Q3) and the Lower Quartile (Q1).
Data plotted above a number line. Duplicate data points are placed in a stack.
Diagram showing Median, Q1, Q3, minimum and maximum values. 5 point summary.